The homes and businesses with only one wired internet choice
As of June 30, 2026, 36.6%1 of US homes and businesses have exactly one wired provider offering 100/20 Mbps, down from 49.3%2 in June 2022. In cities and suburbs that one wire is usually a cable network; in parts of the rural Plains and Appalachia it is a cooperative's fiber.
Published November 13, 2026. Data: FCC National Broadband Map, availability as of June 30, 2026 (file revision of November 10, 2026).
Source: FCC, National Broadband Map, data as of June 30, 2026; Census Bureau, Cartographic boundary file cb_2025_us_state_20m. Darker states have larger gaps; DC is the dot. FCC file revision of November 10, 2026. Shares are of broadband serviceable locations (homes and businesses), not people.
Show the numbers
| State | One wired choice |
|---|---|
| North Dakota | 59.3% |
| Nevada | 58.5% |
| Montana | 57.4% |
| Alaska | 55.0% |
| Arizona | 54.2% |
| New Mexico | 53.5% |
| South Dakota | 53.1% |
| Washington | 48.5% |
| Michigan | 46.9% |
| West Virginia | 46.7% |
| Wisconsin | 45.9% |
| Minnesota | 45.4% |
| Massachusetts | 43.7% |
| California | 43.2% |
| Vermont | 42.7% |
| South Carolina | 42.4% |
| Oregon | 42.3% |
| Arkansas | 42.3% |
| Mississippi | 41.8% |
| Delaware | 40.9% |
| North Carolina | 39.5% |
| Maine | 39.2% |
| Idaho | 39.1% |
| Kentucky | 38.0% |
| Alabama | 37.5% |
| Louisiana | 36.9% |
| New York | 35.8% |
| Illinois | 35.2% |
| New Jersey | 34.8% |
| Pennsylvania | 34.6% |
| Iowa | 34.6% |
| Oklahoma | 34.1% |
| Ohio | 34.0% |
| Georgia | 34.0% |
| Virginia | 33.0% |
| Wyoming | 32.7% |
| Colorado | 32.4% |
| Indiana | 32.4% |
| Maryland | 32.0% |
| Tennessee | 30.8% |
| Missouri | 30.4% |
| Florida | 30.2% |
| Utah | 26.8% |
| New Hampshire | 26.7% |
| Nebraska | 25.4% |
| Kansas | 25.2% |
| Texas | 24.2% |
| Hawaii | 19.0% |
| Connecticut | 17.9% |
| Rhode Island | 16.7% |
| District of Columbia | 5.5% |
How many places have only one wired provider
In the FCC National Broadband Map as of June 30, 2026 (file revision of November 10, 2026), 42.4 million homes and businesses, 36.6%1 of all locations, have exactly one wired provider offering at least 100 Mbps download and 20 Mbps upload. Wired here means fiber, cable or DSL; 100/20 Mbps is the FCC's current fixed broadband benchmark (definitions in the methodology). A location is a house, an apartment building or a small business, not a household.
That middle group sits between two others. 7.8% of locations have no wired provider at that speed, and 55.6%1 have two or more. "Available" is what providers report: service they could install within ten business days of a standard request. Reports can be wrong for single addresses and can be challenged.
Source: FCC, National Broadband Map, data as of June 30, 2022; FCC, National Broadband Map, data as of December 31, 2025; FCC, National Broadband Map, data as of June 30, 2026. Shares of broadband serviceable locations in each FCC release (latest revision of each); the small number is the change in percentage points since June 30, 2022. The FCC's count of locations is updated with each release, so shares are compared rather than counts.
Show the numbers
| Measure | June 30, 2022 | December 31, 2025 | June 30, 2026 | Change (points) |
|---|---|---|---|---|
| No wired choice | 14.1% | 8.2% | 7.8% | −6.3 pts |
| One wired choice | 49.3% | 38.1% | 36.6% | −12.6 pts |
| Two wired choices | 32.7% | 43.8% | 44.6% | 11.8 pts |
| Three or more wired choices | 4.0% | 9.9% | 11.1% | 7.1 pts |
The single-wire share has fallen by 12.6 percentage points since June 2022, and the share with two or more wired providers has risen by 18.9 percentage points. Most of that fall came before December 31, 2025; in the six months since, the single-wire share moved by −1.5 percentage points1.
The one wire is usually a cable network
The FCC data record, for each provider, the locations where it is the only wired option at 100/20 Mbps. Two cable companies account for more than half of all such locations: Spectrum at 12,749,844 locations and Xfinity at 12,657,596. Cox follows with 2,746,445, then Optimum with 1,236,057, Sparklight with 770,759 and Mediacom with 641,8891.
The largest fiber builders look different. AT&T reports service at 65.7 million locations but is the only wired 100/20 option at 483,552 of them; Verizon, with 71.9 million locations across all its technologies, at 230,4581. Where these companies report fiber, a cable network almost always reports service too. The one-wire map is, in large part, the map of cable systems that no fiber network has yet overlapped.
Where the share is highest: the interior West and the northern Plains
Source: FCC, National Broadband Map, data as of June 30, 2026. FCC file revision of November 10, 2026. Shares are of broadband serviceable locations (homes and businesses), not people.
Show the numbers
| State | One wired choice |
|---|---|
| North Dakota | 59.3% |
| Nevada | 58.5% |
| Montana | 57.4% |
| Alaska | 55.0% |
| Arizona | 54.2% |
| New Mexico | 53.5% |
| South Dakota | 53.1% |
| Washington | 48.5% |
| Michigan | 46.9% |
| West Virginia | 46.7% |
| Wisconsin | 45.9% |
| Minnesota | 45.4% |
| Massachusetts | 43.7% |
| California | 43.2% |
| Vermont | 42.7% |
| United States | 36.6% |
North Dakota has the highest share of any state at 59.3%, just ahead of Nevada at 58.5%, where Cox alone is the only wired 100/20 provider at 42.9% of the state's locations. Then come Montana at 57.4%, Alaska at 55.0% and New Mexico at 53.5%. In the western states on the list, one cable company accounts for most of that share: GCI at 48.0% of Alaska's locations, Xfinity at 38.1% of New Mexico's, Spectrum at 33.4% of Montana's and Cox at 37.6%1 of Arizona's.
The lowest shares are in the dense Northeast and the capital: the District of Columbia at 5.5%, Rhode Island at 16.7% and Connecticut at 17.9%1.
Shares and counts rank differently. California, with 43.2%, has the largest number of single-wire locations of any state, 4.4 million; Texas has 2.5 million even though its share, 24.2%, is the 5th lowest1 among the states and DC.
Source: FCC, National Broadband Map, data as of June 30, 2026; Census Bureau, Cartographic boundary file cb_2025_us_state_20m. Darker states have larger gaps; DC is the dot. FCC file revision of November 10, 2026. Shares are of broadband serviceable locations (homes and businesses), not people.
Show the numbers
| State | One wired choice |
|---|---|
| North Dakota | 59.3% |
| Nevada | 58.5% |
| Montana | 57.4% |
| Alaska | 55.0% |
| Arizona | 54.2% |
| New Mexico | 53.5% |
| South Dakota | 53.1% |
| Washington | 48.5% |
| Michigan | 46.9% |
| West Virginia | 46.7% |
| Wisconsin | 45.9% |
| Minnesota | 45.4% |
| Massachusetts | 43.7% |
| California | 43.2% |
| Vermont | 42.7% |
| South Carolina | 42.4% |
| Oregon | 42.3% |
| Arkansas | 42.3% |
| Mississippi | 41.8% |
| Delaware | 40.9% |
| North Carolina | 39.5% |
| Maine | 39.2% |
| Idaho | 39.1% |
| Kentucky | 38.0% |
| Alabama | 37.5% |
| Louisiana | 36.9% |
| New York | 35.8% |
| Illinois | 35.2% |
| New Jersey | 34.8% |
| Pennsylvania | 34.6% |
| Iowa | 34.6% |
| Oklahoma | 34.1% |
| Ohio | 34.0% |
| Georgia | 34.0% |
| Virginia | 33.0% |
| Wyoming | 32.7% |
| Colorado | 32.4% |
| Indiana | 32.4% |
| Maryland | 32.0% |
| Tennessee | 30.8% |
| Missouri | 30.4% |
| Florida | 30.2% |
| Utah | 26.8% |
| New Hampshire | 26.7% |
| Nebraska | 25.4% |
| Kansas | 25.2% |
| Texas | 24.2% |
| Hawaii | 19.0% |
| Connecticut | 17.9% |
| Rhode Island | 16.7% |
| District of Columbia | 5.5% |
In rural counties, one wire is often fiber
North Dakota's high share has a different shape from Nevada's. Fiber reaches 73.1% of North Dakota's locations, the largest provider in many of its rural counties is a telephone cooperative, and Midco, a cable company, is the only wired option at just 16.9%. In Emmons County, 100.0% of locations have one wired provider at 100/20 Mbps, and 100.0% have fiber: the county's single network is BEK Communications Cooperative's fiber. Wolfe County, Kentucky (100.0% fiber, served by Mountain Rural Telephone Cooperative), and Graham County, Kansas (100.0%1 fiber, Nex-Tech), show the same pattern.
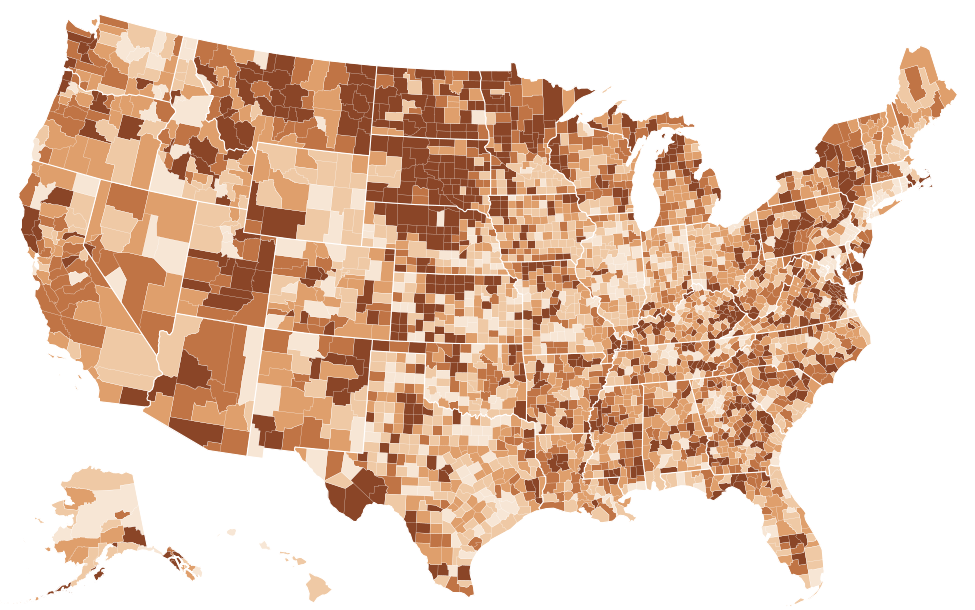
Source: FCC, National Broadband Map, data as of June 30, 2026; Census Bureau, Cartographic boundary file cb_2025_us_county_5m. FCC file revision of November 10, 2026. Shares are of broadband serviceable locations (homes and businesses), not people. The table lists the 25 highest and 25 lowest counties; every county is in the downloads.
Show the numbers
| County | One wired choice |
|---|---|
| Graham County, Kansas | 100.0% |
| Burke County, North Dakota | 100.0% |
| Golden Valley County, North Dakota | 100.0% |
| Grant County, North Dakota | 100.0% |
| Kidder County, North Dakota | 100.0% |
| LaMoure County, North Dakota | 100.0% |
| Logan County, North Dakota | 100.0% |
| Nelson County, North Dakota | 100.0% |
| Hyde County, South Dakota | 100.0% |
| Sully County, South Dakota | 100.0% |
| Menifee County, Kentucky | 100.0% |
| Dickey County, North Dakota | 100.0% |
| Ness County, Kansas | 100.0% |
| Wolfe County, Kentucky | 100.0% |
| Emmons County, North Dakota | 100.0% |
| McIntosh County, North Dakota | 100.0% |
| Ransom County, North Dakota | 99.9% |
| Potter County, South Dakota | 99.9% |
| Pickett County, Tennessee | 99.9% |
| Harding County, South Dakota | 99.9% |
| Jackson County, Kentucky | 99.9% |
| McPherson County, South Dakota | 99.9% |
| Clay County, Tennessee | 99.9% |
| Hettinger County, North Dakota | 99.9% |
| Sanborn County, South Dakota | 99.9% |
| Martinsville city, Virginia | 4.4% |
| Newton County, Arkansas | 4.4% |
| Philadelphia County, Pennsylvania | 4.4% |
| Montgomery County, Maryland | 4.3% |
| Idaho County, Idaho | 4.1% |
| Custer County, Colorado | 3.8% |
| Niobrara County, Wyoming | 3.8% |
| Apache County, Arizona | 3.4% |
| Gray County, Texas | 3.1% |
| Columbia County, Washington | 3.0% |
| Toole County, Montana | 2.7% |
| St. John the Baptist Parish, Louisiana | 2.7% |
| Wheeler County, Texas | 1.7% |
| Falls Church city, Virginia | 1.4% |
| Alexander County, Illinois | 0.8% |
| Ketchikan Gateway Borough, Alaska | 0.7% |
| White Pine County, Nevada | 0.5% |
| Esmeralda County, Nevada | 0.5% |
| Mineral County, Montana | 0.4% |
| Yukon-Koyukuk Census Area, Alaska | 0.1% |
| Lewis County, Idaho | 0.0% |
| Eureka County, Nevada | 0.0% |
| Bristol Bay Borough, Alaska | 0.0% |
| Kusilvak Census Area, Alaska | 0.0% |
| Yakutat City and Borough, Alaska | 0.0% |
One choice of provider is not the same as a slow connection. In these counties the single wire is a fiber line; in a western suburb it is usually a cable network. What a single-wire location lacks is a second wired company to switch to.
Cities on one wire
Among the large cities this site covers, New Bedford, Massachusetts has the highest share of single-wire locations, 99.9%, with Xfinity the only wired 100/20 provider at 99.9% of locations and fiber reported at 0.0%. Albany, New York is next at 96.1%, almost all of it Spectrum's network (96.1%1 of locations).
| Area | One wired choice | One wired choice (June 30, 2022) | Fiber available | Two or more wired choices |
|---|---|---|---|---|
| New Bedford, Massachusetts | 99.9% | 99.6% | 0.0% | 0.0% |
| Albany, New York | 96.1% | 92.0% | 2.0% | 0.4% |
| Tempe, Arizona | 83.7% | 90.8% | 22.3% | 7.5% |
| Anchorage, Alaska | 87.7% | 94.0% | 6.2% | 8.3% |
| Henderson, Nevada | 70.4% | 75.3% | 44.9% | 27.3% |
| Worcester, Massachusetts | 62.8% | 93.3% | 35.3% | 34.3% |
| United States | 36.6% | 49.3% | 62.6% | 55.6% |
Source: FCC, National Broadband Map, data as of June 30, 2026; FCC, National Broadband Map, data as of June 30, 2022. FCC file revision of November 10, 2026. Shares are of broadband serviceable locations (homes and businesses), not people.
The same pattern runs through the West: Cox is the only wired 100/20 provider at 83.1% of locations in Tempe and 69.7% in Henderson, Nevada, and GCI at 87.1% in Anchorage. Worcester shows a city in transition: its single-wire share fell from 93.3% in June 2022 to 62.8%, as fiber went from 0.0%2 of locations to 35.3%1.
How a one-wire city gains a second
The steepest falls since 2022 came in cities where fiber went from rare to reported at nearly every location.
| Area | One wired choice (June 30, 2022) | One wired choice | Fiber available (June 30, 2022) | Fiber available |
|---|---|---|---|---|
| Rio Rancho, New Mexico | 94.5% | 3.6% | 1.2% | 97.0% |
| Brockton, Massachusetts | 99.4% | 9.9% | 0.0% | 90.1% |
| Simi Valley, California | 80.5% | 0.9% | 3.1% | 99.9% |
| United States | 49.3% | 36.6% | 37.2% | 62.6% |
Source: FCC, National Broadband Map, data as of June 30, 2022; FCC, National Broadband Map, data as of June 30, 2026. FCC file revision of November 10, 2026. Shares are of broadband serviceable locations (homes and businesses), not people.
In Rio Rancho, New Mexico, 94.5% of locations had a single wired 100/20 provider in June 2022 and 3.6% do now; fiber went from 1.2% to 97.0%. In Brockton, Massachusetts the share fell from 99.4% to 9.9% as Verizon's fiber arrived. Simi Valley, California fell from 80.5%2 to 0.9%, and 89.2%1 of its locations now have two fiber networks.
The single-wire share can also rise as coverage improves. Montana (+1.7 percentage points) and Rhode Island (+1.0 percentage points) are the only states where it is higher than in June 2022. Over the same period Montana's share of locations with no wired 100/20 provider fell by 13.8 percentage points, from 37.7%2 to 23.9%1. That pattern fits places with no wired 100/20 provider gaining their first and moving into the one-wire group.
If your address shows one wired provider
The FCC National Broadband Map lists every provider and technology reported at an address, with the as-of date of the data. If a provider listed there cannot install service, the map's challenge process is the way to report it; corrections appear in later revisions.
A single wired provider does not always mean a single option. Licensed fixed wireless, which includes 5G home internet, is reported at 87.3% of US locations, and at 100/20 Mbps or more at 47.9%1. Satellite service is reported almost everywhere. These options do not appear in the wired counts on this page, and like all speeds in the FCC data, theirs are advertised maximums. The FCC data contain no prices; each provider publishes a broadband facts label for its plans.
Questions about having one internet provider
How common is it to have only one internet provider?
For wired service at 100/20 Mbps, 36.6% of US locations (42.4 million) had exactly one provider in the FCC data as of June 30, 2026. Another 7.8%1 had none.
Does 5G home internet count as a second provider?
Not in the wired count on this page. Licensed fixed wireless, which includes 5G home internet, is reported at 87.3% of US locations and at 100/20 Mbps or more at 47.9%1. It is a separate option, offered over a cellular network rather than a line to the building.
How can I check who serves my address?
Search the address on the FCC National Broadband Map, which lists every provider and technology reported there. If a listed provider cannot install service, the map's challenge process lets you report it.
Sources
- FCC, National Broadband Map, data as of June 30, 2026; Availability as of June 30, 2026; released November 10, 2026. broadbandmap.fcc.gov
- FCC, National Broadband Map, data as of June 30, 2022; Availability as of June 30, 2022; released May 10, 2024. broadbandmap.fcc.gov
- FCC, National Broadband Map, data as of December 31, 2025; Availability as of December 31, 2025; released November 3, 2026. broadbandmap.fcc.gov
- Census Bureau, Cartographic boundary file cb_2025_us_state_20m. www2.census.gov
- Census Bureau, Cartographic boundary file cb_2025_us_county_5m. www2.census.gov
How every figure is built: methodology. Found an error? Write to [email protected]; corrections are listed on the updates page.