DSL internet: where copper lines are still offered, and how fast
Providers report DSL service over copper telephone lines at 41.9 million US homes and businesses, 36.2%1 of the locations the FCC counts, as of June 30, 2026. Four years earlier the share was 54.8%2, and no other technology has lost as much ground. Most of the DSL that remains is advertised below the FCC's 100/20 Mbps broadband benchmark.
Data: FCC National Broadband Map, availability as of June 30, 2026 (file revision of November 10, 2026).
Source: FCC, National Broadband Map, data as of June 30, 2026; Census Bureau, Cartographic boundary file cb_2025_us_state_20m. Darker states are higher; DC is the dot. FCC file revision of November 10, 2026. Shares are of broadband serviceable locations (homes and businesses), not people.
Show the numbers
| State | DSL available |
|---|---|
| New Mexico | 72.2% |
| Wyoming | 66.3% |
| Arizona | 64.4% |
| Montana | 61.4% |
| Alaska | 58.9% |
| Colorado | 57.3% |
| Minnesota | 54.1% |
| Iowa | 54.1% |
| Utah | 53.6% |
| Nevada | 52.7% |
| Idaho | 51.8% |
| Illinois | 50.9% |
| Tennessee | 49.4% |
| Wisconsin | 49.3% |
| Nebraska | 47.8% |
| Mississippi | 47.6% |
| Missouri | 47.6% |
| Louisiana | 47.4% |
| Alabama | 46.7% |
| Georgia | 46.4% |
| South Dakota | 45.3% |
| California | 43.7% |
| Florida | 43.5% |
| Oregon | 43.1% |
| Michigan | 42.5% |
| North Carolina | 42.3% |
| South Carolina | 40.4% |
| Ohio | 39.8% |
| Kansas | 39.4% |
| Arkansas | 37.2% |
| Washington | 36.8% |
| Vermont | 36.2% |
| Indiana | 36.1% |
| Kentucky | 35.9% |
| Oklahoma | 34.2% |
| North Dakota | 33.2% |
| Texas | 26.7% |
| Maine | 24.5% |
| New Hampshire | 18.1% |
| West Virginia | 15.1% |
| Connecticut | 13.4% |
| Pennsylvania | 10.5% |
| Hawaii | 10.2% |
| Virginia | 8.7% |
| New York | 4.9% |
| New Jersey | 2.3% |
| Maryland | 0.4% |
| Massachusetts | 0.0% |
| Delaware | 0.0% |
| District of Columbia | 0.0% |
| Rhode Island | 0.0% |
How the FCC records DSL
Every figure on this page counts broadband serviceable locations, the houses, apartment buildings and small businesses on the FCC's list, as of June 30, 2026 (FCC revision of November 10, 2026). A location has DSL when a provider files that it offers internet over copper telephone wire there, FCC technology code 10, or could connect it within ten business days. Anyone who finds a listing wrong can challenge it on the FCC map.
Two limits apply. A filing says nothing about subscribers: the Census Bureau's American Community Survey asks about broadband subscriptions but cannot separate DSL from cable or fiber. And a speed in the filing is the fastest the provider advertises at that location, not a test result. Our methodology gives the full definitions.
A Western and Midwestern technology
DSL is reported at 41,929,861 locations nationally. The share is highest in the interior West: 72.2% of locations in New Mexico, 66.3% in Wyoming, 64.4% in Arizona, 61.4% in Montana and 58.9% in Alaska. Along parts of the East Coast it has almost disappeared from the filings. Massachusetts, Rhode Island and Delaware show 0.0%, 0.0% and 0.0%1, although DSL was reported at 23.6%, 22.0% and 27.1%2 of their locations in June 2022.
| New Mexico | 72.2% | 36.4% | 70.8% | 81.8% |
|---|---|---|---|---|
| Wyoming | 66.3% | 56.9% | 59.9% | 74.9% |
| Arizona | 64.4% | 41.5% | 69.8% | 87.3% |
| Montana | 61.4% | 42.5% | 52.0% | 76.1% |
| Alaska | 58.9% | 17.1% | 57.6% | 65.8% |
| Colorado | 57.3% | 59.7% | 81.9% | 89.4% |
| Minnesota | 54.1% | 62.6% | 70.9% | 91.9% |
| Iowa | 54.1% | 77.5% | 62.5% | 90.4% |
| United States | 36.2% | 62.6% | 80.3% | 92.3% |
Source: FCC, National Broadband Map, data as of June 30, 2026. FCC file revision of November 10, 2026. Shares are of broadband serviceable locations (homes and businesses), not people.
DSL is not only a rural product. Among the 343 largest US cities, the highest share is in Albuquerque, where DSL is reported at 91.3% of locations, 1.0 percentage points more than in 2022. Rochester, Minnesota (89.5%), Davenport (89.2%) and Cedar Rapids (88.3%) follow. In these cities DSL is rarely the only wire: cable is reported at 99.4% of Albuquerque's locations and 95.9% of Rochester's, and fiber at 94.3%1 of Davenport's.
Source: FCC, National Broadband Map, data as of June 30, 2026. FCC file revision of November 10, 2026. Shares are of broadband serviceable locations (homes and businesses), not people.
Show the numbers
| Large city | DSL available |
|---|---|
| Albuquerque, New Mexico | 91.3% |
| Deltona, Florida | 90.2% |
| Rochester, Minnesota | 89.5% |
| Davenport, Iowa | 89.2% |
| Cedar Rapids, Iowa | 88.3% |
| Longmont, Colorado | 86.1% |
| Rio Rancho, New Mexico | 86.0% |
| Sterling Heights, Michigan | 85.2% |
| Simi Valley, California | 84.9% |
| Naperville, Illinois | 84.9% |
| Greeley, Colorado | 84.8% |
| Glendale, Arizona | 84.7% |
| Tallahassee, Florida | 84.3% |
| Billings, Montana | 83.7% |
| Las Cruces, New Mexico | 83.5% |
| United States | 36.2% |
The county map gives the finer grain, from counties where the copper footprint covers nearly every location to counties with almost none.
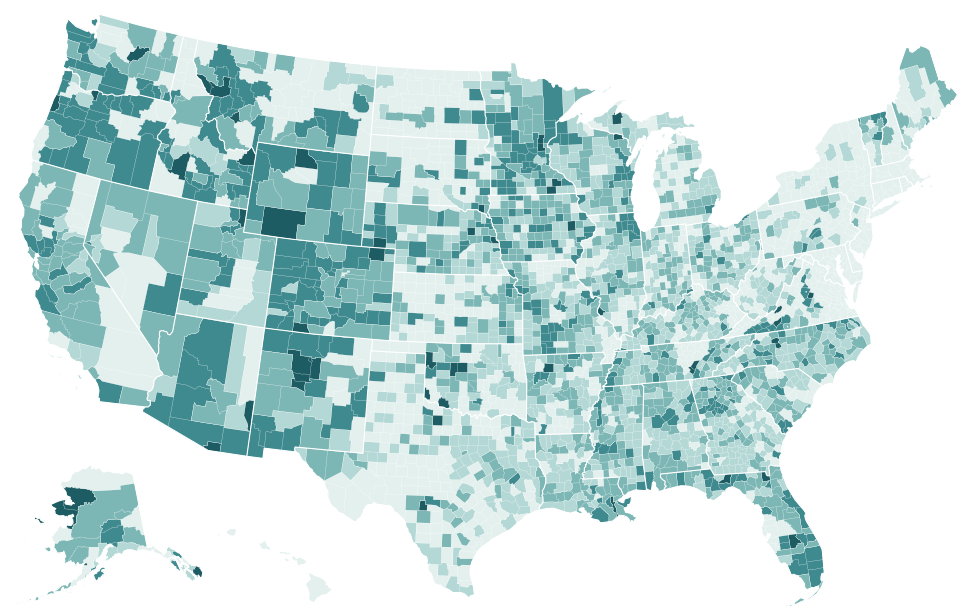
Source: FCC, National Broadband Map, data as of June 30, 2026; Census Bureau, Cartographic boundary file cb_2025_us_county_5m. FCC file revision of November 10, 2026. Shares are of broadband serviceable locations (homes and businesses), not people. The table lists the 25 highest and 25 lowest counties; every county is in the downloads.
Show the numbers
| County | DSL available |
|---|---|
| Davie County, North Carolina | 100.0% |
| Bledsoe County, Tennessee | 99.3% |
| Baker County, Florida | 97.5% |
| Ketchikan Gateway Borough, Alaska | 97.0% |
| Northwest Arctic Borough, Alaska | 94.1% |
| Sequatchie County, Tennessee | 93.9% |
| Los Alamos County, New Mexico | 92.6% |
| Baylor County, Texas | 92.4% |
| Mineral County, Montana | 92.3% |
| Tillman County, Oklahoma | 92.2% |
| Greenlee County, Arizona | 91.9% |
| Monroe County, Illinois | 91.0% |
| Big Horn County, Wyoming | 90.9% |
| Fremont County, Idaho | 90.3% |
| Craig County, Virginia | 89.3% |
| Douglas County, Washington | 89.3% |
| Floyd County, Virginia | 89.1% |
| Blaine County, Oklahoma | 89.1% |
| Bernalillo County, New Mexico | 89.1% |
| Isanti County, Minnesota | 88.2% |
| Real County, Texas | 88.2% |
| Ellis County, Oklahoma | 87.3% |
| Yadkin County, North Carolina | 86.9% |
| Sweetwater County, Wyoming | 85.9% |
| Santa Fe County, New Mexico | 85.8% |
| Emporia city, Virginia | 0.0% |
| Fairfax city, Virginia | 0.0% |
| Falls Church city, Virginia | 0.0% |
| Franklin city, Virginia | 0.0% |
| Fredericksburg city, Virginia | 0.0% |
| Hampton city, Virginia | 0.0% |
| Harrisonburg city, Virginia | 0.0% |
| Hopewell city, Virginia | 0.0% |
| Manassas city, Virginia | 0.0% |
| Manassas Park city, Virginia | 0.0% |
| Newport News city, Virginia | 0.0% |
| Norfolk city, Virginia | 0.0% |
| Norton city, Virginia | 0.0% |
| Petersburg city, Virginia | 0.0% |
| Poquoson city, Virginia | 0.0% |
| Portsmouth city, Virginia | 0.0% |
| Radford city, Virginia | 0.0% |
| Richmond city, Virginia | 0.0% |
| Roanoke city, Virginia | 0.0% |
| Salem city, Virginia | 0.0% |
| Staunton city, Virginia | 0.0% |
| Suffolk city, Virginia | 0.0% |
| Williamsburg city, Virginia | 0.0% |
| Winchester city, Virginia | 0.0% |
| Yakutat City and Borough, Alaska | 0.0% |
The companies that still file DSL
402 brands report DSL somewhere in the country, but the footprint is concentrated. AT&T files DSL at 23.3 million locations, 20.1% of all US locations, and fiber at a nearly equal 23.5 million. CenturyLink follows at 9.7 million, then Brightspeed (3.0 million), Frontier (2.0 million) and Kinetic (1.4 million1). Below them are regional and cooperative telephone companies such as Consolidated Communications and TDS.
| AT&T | 23,271,883 | 20.1% | 21 | 100 Mbps |
|---|---|---|---|---|
| CenturyLink | 9,748,481 | 8.4% | 18 | 140 Mbps |
| Brightspeed | 3,011,859 | 2.6% | 20 | 140 Mbps |
| Frontier | 2,007,454 | 1.7% | 26 | 200 Mbps |
| Kinetic | 1,367,503 | 1.2% | 19 | 300 Mbps |
| Consolidated Communications | 547,400 | 0.5% | 22 | 500 Mbps |
| TDS | 214,143 | 0.2% | 25 | 50 Mbps |
| Ethos Broadband | 87,566 | 0.1% | 2 | 300 Mbps |
| Sparklight | 65,013 | 0.1% | 3 | 30 Mbps |
| Pioneer Telephone Cooperative, Inc. | 61,317 | 0.1% | 3 | 46 Mbps |
| ARVIG | 54,636 | 0.0% | 2 | 100 Mbps |
| Matanuska Telecom Association Inc. | 52,139 | 0.0% | 1 | 120 Mbps |
Source: FCC, National Broadband Map, data as of June 30, 2026. Broadband serviceable locations in the 50 states and DC where the provider reports this technology, as of June 30, 2026.
CenturyLink's filing is now almost all copper: DSL at 9,748,481 of its 9,883,7451 locations. Its parent company Lumen said in a February 2, 2026 release filed with the SEC that it had completed the sale of its consumer fiber business, including Quantum Fiber, to AT&T and was keeping its copper-based consumer services. In the FCC data, CenturyLink's fiber footprint changed by −3,007,0075 locations between December 2025 and June 2026. Brightspeed's DSL network also came from Lumen: in October 2022 Lumen closed the sale of its local phone operations in 20 states to the company.
Wide reach, few lines at 100/20
The FCC's benchmark for broadband is 100 Mbps download with 20 Mbps upload. Measured against it, DSL filings split sharply by company:
- AT&T reports DSL at 100/20 or more at 2,274,276 of its 23.3 million DSL locations; its fastest advertised DSL tier is 100 Mbps.
- CenturyLink reports it at 453,219 of 9.7 million, Kinetic at 249,948 of 1.4 million.
- Brightspeed reports it at 1,022 of 3.0 million, and Frontier at 10 of 2.0 million, even though their fastest DSL tiers are 140 Mbps and 200 Mbps.
- TDS reports no DSL at 100/20; its fastest DSL tier is 50 Mbps1.
A provider's top tier is the best it advertises anywhere, not what most of its copper lines can carry. The gap shows up in the states where DSL is most common. CenturyLink reports service at 68.1% of New Mexico's locations but 100/20 Mbps at 3.7%; in Wyoming the figures are 59.8% and 1.7%, in Arizona 60.7% and 4.7%. In Albuquerque CenturyLink reports service at 93.0% of locations and 100/20 at 7.7%1.
The distinction also decides how a location is classed for the federal BEAD program. Under the definitions in our methodology, DSL at 100/20 or more can make a location served, as fiber and cable can; DSL below that speed cannot, however many copper lines reach the building. The fiber and cable pages cover the networks that make up most of the served count.
Four years of retreat
Between June 30, 2022 and June 30, 2026, the national DSL share fell 18.6 percentage points, from 54.8%2 to 36.2%; 1.2 percentage points of that drop came in the last six months. Over the same four years the fiber share rose 25.4 percentage points1.
Source: FCC, National Broadband Map, data as of June 30, 2022; FCC, National Broadband Map, data as of December 31, 2025; FCC, National Broadband Map, data as of June 30, 2026. Shares of broadband serviceable locations in each FCC release (latest revision of each); the small number is the change in percentage points since June 30, 2022. The FCC's count of locations is updated with each release, so shares are compared rather than counts.
Show the numbers
| Measure | June 30, 2022 | December 31, 2025 | June 30, 2026 | Change (points) |
|---|---|---|---|---|
| DSL available | 54.8% | 37.4% | 36.2% | −18.6 pts |
| Fiber available | 37.2% | 59.9% | 62.6% | 25.4 pts |
The fall was steepest in the East. Connecticut's DSL share dropped 49.1 percentage points, from 62.5% to 13.4%, and West Virginia's 42.8 percentage points, from 57.9%2 to 15.1%. In both states Frontier reports service at most locations (80.3% in Connecticut, 48.3% in West Virginia), and it now reports fiber at 76.4% of Connecticut's locations and 35.0%1 of West Virginia's. The filings show copper listings giving way to fiber listings; they do not record whether the copper lines themselves were switched off.
Source: FCC, National Broadband Map, data as of June 30, 2026. FCC file revision of November 10, 2026. Shares are of broadband serviceable locations (homes and businesses), not people.
Show the numbers
| State | DSL available: change since June 30, 2022 |
|---|---|
| United States | −18.6 pts |
| Arkansas | −22.0 pts |
| Rhode Island | −22.0 pts |
| Massachusetts | −23.5 pts |
| Ohio | −24.1 pts |
| Oregon | −24.9 pts |
| Delaware | −27.1 pts |
| Virginia | −27.4 pts |
| Maryland | −28.5 pts |
| Maine | −32.2 pts |
| Pennsylvania | −33.1 pts |
| Washington | −34.1 pts |
| New York | −34.9 pts |
| New Jersey | −35.2 pts |
| West Virginia | −42.8 pts |
| Connecticut | −49.1 pts |
In the interior West and the northern Plains the share barely moved. New Mexico's fell by 2.2 percentage points, Montana's by 1.2 percentage points and South Dakota's by 0.3 percentage points, and Wyoming's was essentially unchanged (0.0 percentage points). North Dakota is the only state where it rose, by 0.6 percentage points1. Each state page has its own DSL figure and providers.
What DSL can and cannot tell a buyer
A DSL listing at an address means a provider files that it can install service there; the advertised tier filed for that address is the figure to check. The FCC data contain no prices, no speed tests and no latency, and they cannot say whether the copper line to one building is in good condition. Prices belong to each provider's broadband facts label.
Where no wired provider reports 100/20, the remaining options are wireless. Licensed fixed wireless, which includes 5G home internet, is reported at 87.3%1 of US locations; the fixed wireless page shows where. Satellite service is reported almost everywhere.
Questions and answers
What is DSL internet?
Digital subscriber line: internet service carried over the copper telephone wires already running to a home. In the FCC's data it is technology code 10, copper wire. Fiber (code 50) and cable (code 40) are separate codes, so a telephone company that offers both is counted under each code where it reports them.
Is DSL internet still available?
Yes, but at fewer places each release. As of June 30, 2026, at least one provider reports DSL at 36.2% of US locations, against 37.4%5 six months earlier and 54.8%2 in June 2022. 4021 brands still file it somewhere. The data show where providers stopped reporting DSL, not their future plans for a given street.
How fast is DSL internet?
The FCC data hold the maximum speeds providers advertise; they contain no speed tests. Among the seven largest DSL filers, the fastest advertised download tiers range from 50 Mbps to 500 Mbps, but those tiers reach few of their lines: AT&T reports DSL at 100/20 Mbps or more at 2,274,276 of its 23,271,883 DSL locations, and Frontier at 10 of 2,007,4541.
Who provides DSL internet?
Almost entirely the local telephone companies. AT&T has the largest DSL footprint, 23.3 million locations, followed by CenturyLink (9.7 million), Brightspeed (3.0 million), Frontier and Kinetic1. To see which company files DSL at one address, search it on the FCC National Broadband Map.
Other technologies
Sources
- FCC, National Broadband Map, data as of June 30, 2026; Availability as of June 30, 2026; released November 10, 2026. broadbandmap.fcc.gov
- FCC, National Broadband Map, data as of June 30, 2022; Availability as of June 30, 2022; released May 10, 2024. broadbandmap.fcc.gov
- Census Bureau, Cartographic boundary file cb_2025_us_state_20m. www2.census.gov
- Census Bureau, Cartographic boundary file cb_2025_us_county_5m. www2.census.gov
- FCC, National Broadband Map, data as of December 31, 2025; Availability as of December 31, 2025; released November 3, 2026. broadbandmap.fcc.gov
How every figure is built: methodology. Found an error? Write to [email protected]; corrections are listed on the updates page.