Satellite internet and Starlink availability in the US
Two satellite networks report service at nearly every home and business in the country and a third at most of them: Starlink at 99.7% of the locations the FCC counts, HughesNet at 99.7%, Viasat at 82.3%, as of June 30, 2026. That makes coverage the wrong question. The useful one is where nothing else reaches: 963,0001 locations, a share that has doubled since 2022.
Data: FCC National Broadband Map, availability as of June 30, 2026 (file revision of November 10, 2026); Census Bureau, American Community Survey 2025 1-year estimates; NTIA, BEAD Final Proposal summaries.
Source: FCC, National Broadband Map, data as of June 30, 2026; Census Bureau, Cartographic boundary file cb_2025_us_state_20m. Darker states have larger gaps; DC is the dot. FCC file revision of November 10, 2026. Shares are of broadband serviceable locations (homes and businesses), not people.
Show the numbers
| State | Satellite only |
|---|---|
| Alaska | 7.2% |
| West Virginia | 6.4% |
| Wyoming | 3.8% |
| Montana | 3.5% |
| Idaho | 2.4% |
| Maine | 2.4% |
| Louisiana | 2.3% |
| Alabama | 1.9% |
| Arkansas | 1.8% |
| Virginia | 1.7% |
| Washington | 1.7% |
| Oregon | 1.7% |
| Hawaii | 1.4% |
| Kentucky | 1.2% |
| New Mexico | 1.2% |
| Colorado | 1.2% |
| Michigan | 1.2% |
| Wisconsin | 1.0% |
| Pennsylvania | 0.9% |
| New York | 0.8% |
| North Carolina | 0.8% |
| Minnesota | 0.7% |
| Arizona | 0.7% |
| Oklahoma | 0.7% |
| California | 0.7% |
| Rhode Island | 0.7% |
| Utah | 0.7% |
| Mississippi | 0.6% |
| South Dakota | 0.6% |
| Missouri | 0.6% |
| Nebraska | 0.6% |
| New Hampshire | 0.5% |
| Georgia | 0.5% |
| Texas | 0.5% |
| Ohio | 0.5% |
| Indiana | 0.5% |
| Illinois | 0.4% |
| Kansas | 0.4% |
| Tennessee | 0.4% |
| Iowa | 0.4% |
| Florida | 0.3% |
| Vermont | 0.3% |
| Massachusetts | 0.3% |
| Nevada | 0.3% |
| Maryland | 0.3% |
| South Carolina | 0.2% |
| Delaware | 0.1% |
| New Jersey | 0.1% |
| Connecticut | 0.1% |
| North Dakota | 0.0% |
| District of Columbia | 0.0% |
As of June 30, 2026 (FCC file revision of November 10, 2026), satellite service is reported at almost every one of the 115.8 million homes and businesses on the FCC's map. Starlink reports 115.4 million locations, HughesNet 115.5 million and Viasat 95.3 million1. A state map of satellite availability would be shaded almost uniformly.
The map below shows something else: the share of locations where satellite is the only service reported, with no fiber, cable, DSL or fixed wireless at any speed. Nationally that is 0.8%, or 963,000 locations. Alaska ranks the highest among the states at 7.2%1.
Source: FCC, National Broadband Map, data as of June 30, 2026; Census Bureau, Cartographic boundary file cb_2025_us_state_20m. Darker states have larger gaps; DC is the dot. FCC file revision of November 10, 2026. Shares are of broadband serviceable locations (homes and businesses), not people.
Show the numbers
| State | Satellite only |
|---|---|
| Alaska | 7.2% |
| West Virginia | 6.4% |
| Wyoming | 3.8% |
| Montana | 3.5% |
| Idaho | 2.4% |
| Maine | 2.4% |
| Louisiana | 2.3% |
| Alabama | 1.9% |
| Arkansas | 1.8% |
| Virginia | 1.7% |
| Washington | 1.7% |
| Oregon | 1.7% |
| Hawaii | 1.4% |
| Kentucky | 1.2% |
| New Mexico | 1.2% |
| Colorado | 1.2% |
| Michigan | 1.2% |
| Wisconsin | 1.0% |
| Pennsylvania | 0.9% |
| New York | 0.8% |
| North Carolina | 0.8% |
| Minnesota | 0.7% |
| Arizona | 0.7% |
| Oklahoma | 0.7% |
| California | 0.7% |
| Rhode Island | 0.7% |
| Utah | 0.7% |
| Mississippi | 0.6% |
| South Dakota | 0.6% |
| Missouri | 0.6% |
| Nebraska | 0.6% |
| New Hampshire | 0.5% |
| Georgia | 0.5% |
| Texas | 0.5% |
| Ohio | 0.5% |
| Indiana | 0.5% |
| Illinois | 0.4% |
| Kansas | 0.4% |
| Tennessee | 0.4% |
| Iowa | 0.4% |
| Florida | 0.3% |
| Vermont | 0.3% |
| Massachusetts | 0.3% |
| Nevada | 0.3% |
| Maryland | 0.3% |
| South Carolina | 0.2% |
| Delaware | 0.1% |
| New Jersey | 0.1% |
| Connecticut | 0.1% |
| North Dakota | 0.0% |
| District of Columbia | 0.0% |
Starlink, HughesNet and Viasat
The three national networks overlap heavily, so their footprints cannot be added. Where they differ is speed: whether they report 100 Mbps download and 20 Mbps upload, the level this site uses as its broadband benchmark. Starlink reports 100/20 or faster at 115,411,631 locations, its entire satellite footprint. HughesNet reports 100/20 at 0 locations and Viasat at 01: their satellite offers in the FCC data fall below that benchmark everywhere.
| HughesNet | 115,463,606 | 99.7% | 50 | 100 Mbps |
|---|---|---|---|---|
| Starlink | 115,411,631 | 99.7% | 51 | 280 Mbps |
| Viasat | 95,329,223 | 82.3% | 49 | 150 Mbps |
| Big Bend Telecom, LTD | 761 | 0.0% | 1 | 0 Mbps |
Source: FCC, National Broadband Map, data as of June 30, 2026. Broadband serviceable locations in the 50 states and DC where the provider reports this technology, as of June 30, 2026.
The footprints are not identical. HughesNet reports service in every state and DC except Hawaii. Viasat's residential footprint is thinnest in New Jersey (0.9% of locations) and Maryland (2.8%), where most of its listings are for business customers only and are not counted here. Starlink reports service at 100.0% of Alaska's locations and its lowest state shares are in Pennsylvania (95.1%) and Maryland (95.6%1).
Since June 2022, the count of locations in Starlink's reported footprint has changed by +5,795,139, HughesNet's by +3,479,322 and Viasat's by −16,803,1653. The FCC's own count of locations changed by +3,495,3291 over the same period, so Starlink's addition was larger than the growth of the list itself. In the latest six months Viasat's count changed by −19,357,5774 locations, the only decline of the three.
The provider pages for Starlink, HughesNet and Viasat have each network's state-by-state figures.
What the FCC records as satellite
Providers report satellite service under two technology codes: 60 for geostationary satellites, which hold a fixed position high above the equator, and 61 for non-geostationary satellites, the low-Earth-orbit constellations such as Starlink's. This site combines both. Each record says the provider offers service at a location and could install it within ten business days, with its fastest advertised download and upload speeds. Like every other record on the map, it can be challenged.
Two limits follow from that. The data do not show whether a network has capacity for new customers at a given address. And the speeds are advertised maximums, not measurements. Shares on this page are of the FCC's broadband serviceable locations (houses, apartment buildings, small businesses), not people.
The states where satellite stands alone
Measured as a share, Alaska ranks the highest at 7.2% of locations, then West Virginia (6.4%), Wyoming (3.8%) and Montana (3.5%). Measured as a count, the order changes. West Virginia has 57,157 satellite-only locations, nearly three times Alaska's 20,366, and California, with a share of only 0.7%, has the most of any state: 67,934. Texas (52,740) and Virginia (48,7831) follow West Virginia, and more than a dozen states count more satellite-only locations than Alaska.
At the other end, satellite-only locations are close to zero in DC (8) and North Dakota (1141), where terrestrial networks reach almost every location.
| Alaska | 7.2% | 20,366 | 6.5% | 17.5% |
|---|---|---|---|---|
| West Virginia | 6.4% | 57,157 | 2.9% | 11.4% |
| Wyoming | 3.8% | 9,998 | 2.1% | 9.2% |
| Montana | 3.5% | 17,471 | 2.4% | 9.1% |
| Idaho | 2.4% | 18,592 | 1.0% | 7.7% |
| Maine | 2.4% | 15,396 | 0.5% | 3.8% |
| Louisiana | 2.3% | 42,974 | 0.8% | 5.1% |
| Alabama | 1.9% | 40,901 | 0.5% | 4.5% |
| Arkansas | 1.8% | 24,566 | 0.6% | 4.8% |
| California | 0.7% | 67,934 | 0.3% | 1.6% |
| United States | 0.8% | 962,554 | 0.4% | 2.4% |
Source: FCC, National Broadband Map, data as of June 30, 2026; FCC, National Broadband Map, data as of June 30, 2022. FCC file revision of November 10, 2026. Shares are of broadband serviceable locations (homes and businesses), not people.
The county map is more scattered than the state map suggests. In Yakutat City and Borough, Alaska, satellite is the only service reported at 100.0% of its 417 locations. Several of the other highest shares are in small counties far from each other: Wheeler County, Oregon (44.9%), Carter County, Missouri (40.3%), Keweenaw County, Michigan (35.6%), and Calhoun County, West Virginia (34.8%1).
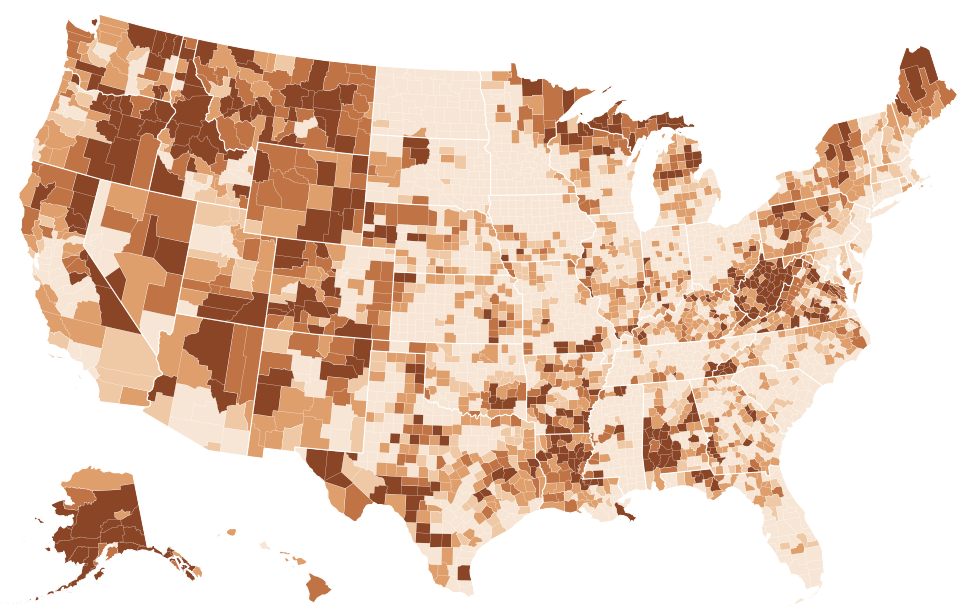
Source: FCC, National Broadband Map, data as of June 30, 2026; Census Bureau, Cartographic boundary file cb_2025_us_county_5m. FCC file revision of November 10, 2026. Shares are of broadband serviceable locations (homes and businesses), not people. The table lists the 25 highest and 25 lowest counties; every county is in the downloads.
Show the numbers
| County | Satellite only |
|---|---|
| Yakutat City and Borough, Alaska | 100.0% |
| Kalawao County, Hawaii | 56.6% |
| Wheeler County, Oregon | 44.9% |
| Southeast Fairbanks Census Area, Alaska | 41.9% |
| Carter County, Missouri | 40.3% |
| Garfield County, Montana | 36.8% |
| Keweenaw County, Michigan | 35.6% |
| Yukon-Koyukuk Census Area, Alaska | 35.1% |
| Calhoun County, West Virginia | 34.8% |
| Catron County, New Mexico | 34.6% |
| Alpine County, California | 34.0% |
| Boise County, Idaho | 33.9% |
| Rappahannock County, Virginia | 33.5% |
| Perry County, Alabama | 33.2% |
| Sumter County, Alabama | 32.6% |
| Petroleum County, Montana | 32.6% |
| Lake and Peninsula Borough, Alaska | 32.0% |
| Sioux County, Nebraska | 31.4% |
| Braxton County, West Virginia | 31.4% |
| Forest County, Pennsylvania | 30.4% |
| Prince of Wales-Hyder Census Area, Alaska | 28.5% |
| East Feliciana Parish, Louisiana | 27.7% |
| Trinity County, California | 27.6% |
| St. Helena Parish, Louisiana | 27.5% |
| Graham County, North Carolina | 26.9% |
| Bailey County, Texas | 0.0% |
| Glasscock County, Texas | 0.0% |
| Hardeman County, Texas | 0.0% |
| Lynn County, Texas | 0.0% |
| Parmer County, Texas | 0.0% |
| Terry County, Texas | 0.0% |
| Wichita County, Texas | 0.0% |
| Alexandria city, Virginia | 0.0% |
| Bristol city, Virginia | 0.0% |
| Emporia city, Virginia | 0.0% |
| Fairfax city, Virginia | 0.0% |
| Falls Church city, Virginia | 0.0% |
| Lexington city, Virginia | 0.0% |
| Manassas city, Virginia | 0.0% |
| Norton city, Virginia | 0.0% |
| Winchester city, Virginia | 0.0% |
| Marion County, Alabama | 0.0% |
| Greene County, Arkansas | 0.0% |
| Sacramento County, California | 0.0% |
| San Francisco County, California | 0.0% |
| Sutter County, California | 0.0% |
| Broomfield County, Colorado | 0.0% |
| Denver County, Colorado | 0.0% |
| Phillips County, Colorado | 0.0% |
| Greater Bridgeport Planning Region, Connecticut | 0.0% |
More satellite-only locations than in 2022
Most gaps on the FCC map have narrowed since June 2022. This one widened. The share of locations with satellite as the only service went from 0.4% in June 2022 to 0.9%4 in December 2025, then eased to 0.8% in June 2026. Over the same four years the share of unserved locations, those without reliable terrestrial service at 25/3 Mbps under the BEAD program's definition, fell from 7.4%3 to 2.4%1.
Source: FCC, National Broadband Map, data as of June 30, 2022; FCC, National Broadband Map, data as of December 31, 2025; FCC, National Broadband Map, data as of June 30, 2026. Shares of broadband serviceable locations in each FCC release (latest revision of each); the small number is the change in percentage points since June 30, 2022. The FCC's count of locations is updated with each release, so shares are compared rather than counts.
Show the numbers
| Measure | June 30, 2022 | December 31, 2025 | June 30, 2026 | Change (points) |
|---|---|---|---|---|
| Satellite only | 0.4% | 0.9% | 0.8% | 0.5 pts |
| Unserved | 7.4% | 2.7% | 2.4% | −5.0 pts |
| No terrestrial 100/20 | 11.5% | 4.5% | 4.2% | −7.3 pts |
West Virginia moved most. Its satellite-only share went from 2.9% in June 2022 to 7.4%4 in December 2025 and was 6.4% in June 2026. Maine went from 0.5% to 2.4%, Louisiana from 0.8% to 2.3%. North Dakota was one of the few states where the share fell, from 0.5%3 to 0.0%1.
The data record these shifts, not their reasons. A location moves into the satellite-only group when a terrestrial provider stops reporting it, when a successful challenge removes a record, or when a new location is added where only satellite is reported. The FCC's location list changes with every release, which is why this page compares shares rather than counts.
How many households subscribe
Availability on the map says nothing about use. The Census Bureau's American Community Survey asks households what kind of internet subscription they have, and satellite is one of the answers. In 2025, 16.0% of Alaska households (±1.1 percentage points) reported a satellite subscription, which ranks the highest among the states. In 2019 it was 6.0% (±0.9 percentage points7); the two estimates are far enough apart that the rise is clear. Wyoming (14.1%), Idaho (12.6%) and Montana (12.2%) follow. Massachusetts has the lowest estimate, 3.4%6.
Source: Census Bureau, American Community Survey 2025 1-year detailed tables. Whiskers show the 90% margin of error. Period: 2025.
Show the numbers
| State | Households with satellite internet | MOE |
|---|---|---|
| Alaska | 16.0% | ±1.1 |
| Wyoming | 14.1% | ±1.3 |
| Idaho | 12.6% | ±0.6 |
| Montana | 12.2% | ±0.8 |
| New Mexico | 10.1% | ±0.7 |
| West Virginia | 9.5% | ±0.7 |
| Mississippi | 9.4% | ±0.5 |
| Alabama | 8.8% | ±0.4 |
| Arizona | 8.6% | ±0.3 |
| Nevada | 8.5% | ±0.6 |
| Colorado | 8.4% | ±0.4 |
| Louisiana | 8.4% | ±0.4 |
| Missouri | 8.4% | ±0.3 |
| Oklahoma | 8.3% | ±0.3 |
| Iowa | 8.1% | ±0.4 |
These are survey estimates of households, counted whether satellite is their only subscription or one of several, and they come from respondents rather than providers. They do not line up with the FCC's satellite-only shares: West Virginia's satellite-only share ranks 2nd highest1 on the map, but it ranks 6th highest for satellite subscriptions at 9.5%6.
Satellite in the BEAD plans
The state final proposals for the Broadband Equity, Access, and Deployment program list a technology for each location they fund. Across the proposals in the data, 829,696 of 3,772,113 locations went to low-Earth-orbit satellite. The share varies widely by state. Montana, which ranks the highest, assigned 63.7% of its BEAD locations to satellite, followed by Colorado (49.6%), South Carolina (48.7%) and Ohio (48.1%). Delaware (0 locations), Connecticut (0) and North Dakota (08) assigned none.
Source: NTIA BroadbandUSA, BEAD Final Proposal Overview one-page PDFs.
Show the numbers
| State | BEAD locations assigned to low-Earth-orbit satellite |
|---|---|
| Montana | 63.7% |
| Colorado | 49.6% |
| South Carolina | 48.7% |
| Ohio | 48.1% |
| Oregon | 46.5% |
| Wyoming | 40.8% |
| South Dakota | 38.3% |
| Massachusetts | 34.8% |
| North Carolina | 34.6% |
| Alaska | 33.9% |
| Nebraska | 33.9% |
| Nevada | 28.2% |
| New York | 28.1% |
| Texas | 27.1% |
| California | 27.0% |
Each state page shows its own plan's mix of fiber, fixed wireless and satellite. For homes where satellite is not the only choice, the fiber and 5G home internet pages show where the terrestrial alternatives reach. Plan prices and terms are not in the FCC data; they belong to each provider's broadband facts label.
Questions about satellite and Starlink availability
Is Starlink available everywhere in the US?
Almost. Starlink reports service at 115.4 million locations in all 50 states and DC, 99.7% of the FCC's total, as of June 30, 2026. Its reported share is lower in a few states, lowest in Pennsylvania (95.1%) and Maryland (95.6%1). A reported location is one where the provider says it could install service within ten business days; it is not a guarantee of capacity at a given address.
Is satellite internet counted as broadband on this site?
It is shown, but not counted in the coverage headlines. Satellite providers report nearly every location, so including them would make every area look fully served. This site's served, unserved and wired-choice measures count only terrestrial service, so satellite never makes a location served. It appears separately, as the only option where nothing else is reported.
Which satellite internet providers serve the US?
4 brands report satellite service to the FCC. Three are national: HughesNet (115.5 million locations), Starlink (115.4 million) and Viasat (95.3 million). The fourth, Big Bend Telecom, LTD, reports satellite at 7611 locations in one state.
How do I check satellite availability at my address?
Search the address on the FCC's National Broadband Map, which lists every provider reporting service there, satellite included, with its technology and fastest advertised speeds. The satellite provider's own address check is the second step; a state or county share says nothing about a single address.
Other technologies
Sources
- FCC, National Broadband Map, data as of June 30, 2026; Availability as of June 30, 2026; released November 10, 2026. broadbandmap.fcc.gov
- Census Bureau, Cartographic boundary file cb_2025_us_state_20m. www2.census.gov
- FCC, National Broadband Map, data as of June 30, 2022; Availability as of June 30, 2022; released May 10, 2024. broadbandmap.fcc.gov
- FCC, National Broadband Map, data as of December 31, 2025; Availability as of December 31, 2025; released November 3, 2026. broadbandmap.fcc.gov
- Census Bureau, Cartographic boundary file cb_2025_us_county_5m. www2.census.gov
- Census Bureau, American Community Survey 2025 1-year detailed tables; 2025 (calendar-year sample); released October 29, 2026. api.census.gov
- Census Bureau, American Community Survey 2019 1-year detailed tables; 2019. api.census.gov
- NTIA BroadbandUSA, BEAD Final Proposal Overview one-page PDFs. broadbandusa.ntia.gov
Margins of error (±) are at the 90% confidence level. A difference is called significant only when it passes the Census Bureau's test at that level. How every figure is built: methodology. Found an error? Write to [email protected]; corrections are listed on the updates page.