5G home internet in the United States
Licensed fixed wireless, the FCC category that holds 5G home internet, is reported at 87.3% of US homes and businesses as of June 30, 2026, more than any wired technology. The fuller answer is in the speed: at only 47.9% of locations does a provider report it at 100/20 Mbps or faster, and that share ranges from 84.7% in Mississippi to 19.9%1 in Maine.
Data: FCC National Broadband Map, availability as of June 30, 2026 (file revision of November 10, 2026).
Source: FCC, National Broadband Map, data as of June 30, 2026; Census Bureau, Cartographic boundary file cb_2025_us_state_20m. Darker states are higher; DC is the dot. FCC file revision of November 10, 2026. Shares are of broadband serviceable locations (homes and businesses), not people.
Show the numbers
| State | Fixed wireless 100/20 |
|---|---|
| Mississippi | 84.7% |
| Oklahoma | 70.7% |
| New Mexico | 68.5% |
| Kansas | 64.3% |
| Missouri | 63.1% |
| Nebraska | 63.1% |
| Idaho | 62.9% |
| Texas | 62.3% |
| Colorado | 61.9% |
| Illinois | 59.5% |
| Wyoming | 59.4% |
| Ohio | 56.3% |
| California | 56.1% |
| Utah | 55.9% |
| Arizona | 54.8% |
| Indiana | 52.8% |
| Oregon | 50.6% |
| District of Columbia | 49.8% |
| Iowa | 49.6% |
| Minnesota | 47.5% |
| Michigan | 44.1% |
| Alaska | 43.6% |
| Washington | 43.4% |
| Louisiana | 43.0% |
| North Dakota | 42.8% |
| Wisconsin | 42.3% |
| Florida | 42.1% |
| Pennsylvania | 42.0% |
| Nevada | 41.1% |
| Kentucky | 41.0% |
| Arkansas | 41.0% |
| Tennessee | 40.9% |
| Montana | 40.3% |
| South Carolina | 39.3% |
| New York | 39.2% |
| South Dakota | 38.7% |
| New Jersey | 38.0% |
| Delaware | 37.7% |
| Alabama | 37.7% |
| North Carolina | 37.4% |
| Maryland | 35.7% |
| Georgia | 34.5% |
| Virginia | 31.7% |
| Massachusetts | 30.9% |
| Vermont | 30.6% |
| West Virginia | 28.0% |
| Rhode Island | 26.9% |
| New Hampshire | 26.2% |
| Connecticut | 24.6% |
| Hawaii | 20.1% |
| Maine | 19.9% |
At 87.3% of the 115.8 million homes and businesses on the FCC's map, at least one provider reports licensed fixed wireless service, as of June 30, 2026 (FCC file revision of November 10, 2026). That is 101.1 million locations, more than cable (80.3%) or fiber (62.6%) reach. The share reaches nine in ten locations or more in 12 of the 50 states and DC; Mississippi is highest at 95.3%, Alaska lowest at 44.2%1.
The headline share hides a second, smaller map. Only at 47.9%1 of locations does a provider report licensed fixed wireless at 100 Mbps download and 20 Mbps upload or more, the speed the FCC adopted as its broadband benchmark in March 2024. That second map is the one shaded below.
What the FCC files under 5G home internet
The FCC does not record whether a wireless network is 5G or 4G LTE. It records the spectrum. Providers report home service over licensed spectrum as technology code 71 and over licensed-by-rule spectrum as code 72; this site combines both as licensed fixed wireless, the category where the mobile carriers' home internet plans appear. Small wireless internet providers using unlicensed spectrum report code 70 and are counted separately, as are satellite services.
Each record is a provider's statement that it offers service at a location and could install it within ten business days, with its fastest advertised download and upload speeds. Records can be challenged on the map. The shares on this page count the FCC's broadband serviceable locations (houses, apartment buildings, small businesses), not people, and say nothing about what anyone subscribes to.
Three carriers report most of it
3771 providers report licensed fixed wireless somewhere in the country, up from 2873 in June 2022. Three national carriers have by far the largest footprints:
- T-Mobile reports it at 81.5 million locations (70.4% of the US), at 100/20 Mbps or more at 25,917,721 of them; its fastest advertised fixed wireless download is 100 Mbps.
- Verizon reports 62.5 million locations (54.0%), 27,089,583 of them at 100/20 Mbps or more, and the highest advertised tier of the three, 1 Gbps.
- AT&T reports 37.4 million locations (32.3%), 4,412,528 at 100/20 Mbps or more, with a fastest advertised download of 100 Mbps1.
The footprints overlap heavily, so they cannot be added up. The next-largest provider, Nextlink Internet, reports 2.5 million locations. One regional company stands out for how much of its footprint reaches 100/20 rather than for its size: C Spire reports all of its 1.0 million licensed fixed wireless locations at 100/20 Mbps or more, and its service of any kind reaches 93.0%1 of Mississippi's locations.
| T-Mobile | 81,504,410 | 70.4% | 50 | 100 Mbps |
|---|---|---|---|---|
| Verizon | 62,494,806 | 54.0% | 49 | 1 Gbps |
| AT&T | 37,394,690 | 32.3% | 51 | 100 Mbps |
| Nextlink Internet | 2,470,940 | 2.1% | 10 | 1 Gbps |
| Wisper ISP, LLC | 1,211,623 | 1.0% | 6 | 1 Gbps |
| C Spire | 1,014,287 | 0.9% | 1 | 100 Mbps |
| Etheric Networks | 941,129 | 0.8% | 1 | 300 Mbps |
| Unwired Ltd | 762,163 | 0.7% | 1 | 250 Mbps |
| Mercury Fiber | 737,450 | 0.6% | 5 | 150 Mbps |
| W A T C H TV | 720,644 | 0.6% | 5 | 400 Mbps |
| Cal.net | 684,763 | 0.6% | 1 | 100 Mbps |
| Bug Tussel Wireless | 680,317 | 0.6% | 4 | 50 Mbps |
| VTX Communications, LLC | 661,528 | 0.6% | 1 | 940 Mbps |
| Rise Broadband | 602,887 | 0.5% | 12 | 1.3 Gbps |
| Rapid Systems | 546,759 | 0.5% | 1 | 100 Mbps |
Source: FCC, National Broadband Map, data as of June 30, 2026. Broadband serviceable locations in the 50 states and DC where the provider reports this technology, as of June 30, 2026.
Reported almost everywhere, at 100/20 at half of locations
The gap between "reported" and "reported at 100/20" is what separates the states. Mississippi and Maine both have licensed fixed wireless reported at most of their locations (95.3% and 77.5%). On the 100/20 measure they are at opposite ends: Mississippi ranks the highest at 84.7%, followed by Oklahoma (70.7%) and New Mexico (68.5%), while Maine ranks the lowest at 19.9%, with Hawaii (20.1%1) just above it.
New England is the low corner of the second map. Besides Maine, Connecticut (24.6%), New Hampshire (26.2%), Rhode Island (26.9%), Vermont (30.6%) and Massachusetts (30.9%) all sit far below the national 47.9%, although licensed fixed wireless itself is reported at 84.2% of Massachusetts locations and 81.4% of Connecticut's. The same split runs through the largest cities. In New Bedford, Massachusetts, licensed fixed wireless is reported at 76.5% of locations but at 100/20 Mbps at 12.2%, the lowest share among the 343 largest US cities; in Lowell it is 89.8% against 17.0%. In San Angelo, Texas, the 100/20 share is 100.0%1.
Source: FCC, National Broadband Map, data as of June 30, 2026. FCC file revision of November 10, 2026. Shares are of broadband serviceable locations (homes and businesses), not people.
Show the numbers
| Large city | Fixed wireless 100/20 |
|---|---|
| United States | 47.9% |
| Deltona, Florida | 25.9% |
| Temecula, California | 25.6% |
| Lynn, Massachusetts | 25.6% |
| Newport News, Virginia | 24.7% |
| Worcester, Massachusetts | 24.7% |
| Oxnard, California | 24.0% |
| Providence, Rhode Island | 23.5% |
| Moreno Valley, California | 23.0% |
| North Las Vegas, Nevada | 22.7% |
| Menifee, California | 22.6% |
| Santa Maria, California | 22.4% |
| Santa Clarita, California | 21.9% |
| Elizabeth, New Jersey | 20.5% |
| Honolulu, Hawaii | 19.5% |
| Victorville, California | 19.4% |
| Brockton, Massachusetts | 18.6% |
| Bridgeport, Connecticut | 18.4% |
| Waterbury, Connecticut | 18.0% |
| Lowell, Massachusetts | 17.0% |
| New Bedford, Massachusetts | 12.2% |
Fewer locations since 2022, more of them at 100/20
The two measures have moved in opposite directions. Between June 2022 and June 2026 the share of locations with any licensed fixed wireless fell by 3.6 percentage points, from 90.9% to 87.3%, while the share with it at 100/20 Mbps rose from 16.7%3 to 47.9%. In the latest six months the footprint grew by 1.0 percentage points1 and the 100/20 share did not move (47.7%4 in December 2025).
Source: FCC, National Broadband Map, data as of June 30, 2022; FCC, National Broadband Map, data as of December 31, 2025; FCC, National Broadband Map, data as of June 30, 2026. Shares of broadband serviceable locations in each FCC release (latest revision of each); the small number is the change in percentage points since June 30, 2022. The FCC's count of locations is updated with each release, so shares are compared rather than counts.
Show the numbers
| Measure | June 30, 2022 | December 31, 2025 | June 30, 2026 | Change (points) |
|---|---|---|---|---|
| Licensed fixed wireless | 90.9% | 86.4% | 87.3% | −3.6 pts |
| Fixed wireless 100/20 | 16.7% | 47.7% | 47.9% | 31.1 pts |
| Fixed wireless only at 100/20 | 2.6% | 3.7% | 3.6% | 1.0 pts |
The state figures show how unevenly that happened. Mississippi's 100/20 share went from 6.6% in June 2022 to 73.3%4 in December 2025 and 84.7% in June 2026. Alaska's overall footprint grew from 5.8% of locations to 44.2%, the only large increase among the states. Elsewhere the reported footprint shrank: Hawaii from 91.8% to 66.1%, Maine from 92.0% to 77.5%, West Virginia from 79.4%3 to 66.5%1.
These are changes in what providers report, and the FCC's location list itself is revised with each release. The data record the result, not the reason, so a smaller footprint on the map is not by itself evidence that a network was switched off.
Where fixed wireless is the only route to 100/20
Wired service at 100/20 Mbps is reported at 92.3% of US locations. At 3.6% of locations, 4.2 million in all, there is none: the only terrestrial service at 100/20 Mbps or more is fixed wireless, licensed or unlicensed, with no cable, fiber or DSL at that speed. Wyoming's share is the highest among the states, at 15.5%, followed by Idaho (13.2%) and Alaska (11.6%1).
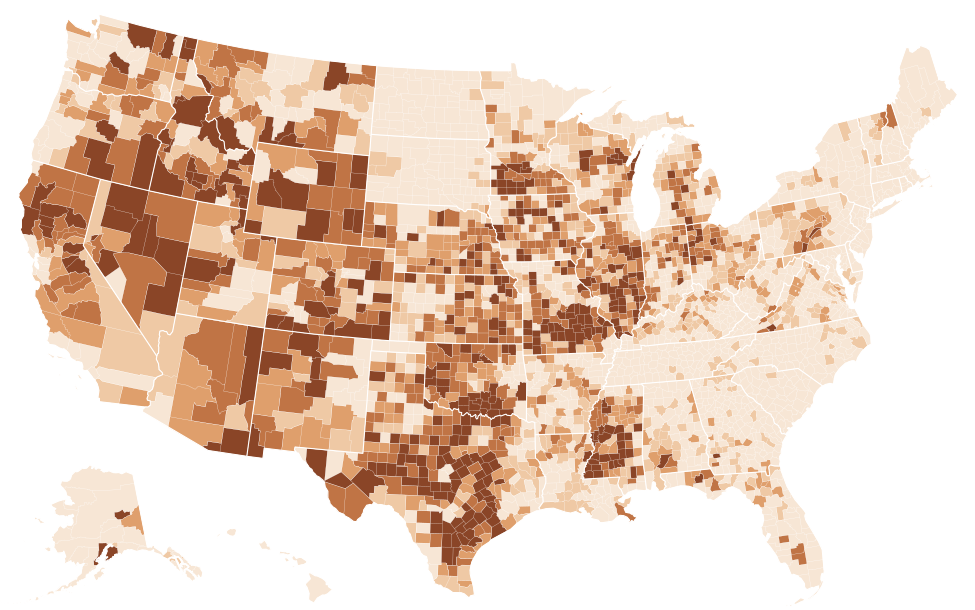
Source: FCC, National Broadband Map, data as of June 30, 2026; Census Bureau, Cartographic boundary file cb_2025_us_county_5m. FCC file revision of November 10, 2026. Shares are of broadband serviceable locations (homes and businesses), not people. The table lists the 25 highest and 25 lowest counties; every county is in the downloads.
Show the numbers
| County | Fixed wireless only at 100/20 |
|---|---|
| Eureka County, Nevada | 92.0% |
| Shannon County, Missouri | 79.0% |
| Osage County, Missouri | 78.4% |
| Alexander County, Illinois | 75.5% |
| Maries County, Missouri | 75.3% |
| Simpson County, Mississippi | 74.7% |
| Goliad County, Texas | 71.3% |
| Jefferson County, Mississippi | 69.3% |
| White Pine County, Nevada | 67.8% |
| Rich County, Utah | 67.0% |
| Issaquena County, Mississippi | 66.7% |
| Upton County, Texas | 66.7% |
| Love County, Oklahoma | 66.2% |
| Rio Arriba County, New Mexico | 66.0% |
| Wright County, Missouri | 64.5% |
| Storey County, Nevada | 64.4% |
| Kenai Peninsula Borough, Alaska | 62.9% |
| Washington County, Colorado | 62.2% |
| Boundary County, Idaho | 62.1% |
| Pershing County, Nevada | 60.5% |
| Lander County, Nevada | 60.2% |
| Claiborne County, Mississippi | 59.2% |
| Hidalgo County, New Mexico | 59.0% |
| Amite County, Mississippi | 58.7% |
| Gasconade County, Missouri | 58.4% |
| Marion County, Alabama | 0.0% |
| Aleutians East Borough, Alaska | 0.0% |
| Aleutians West Census Area, Alaska | 0.0% |
| Bethel Census Area, Alaska | 0.0% |
| Bristol Bay Borough, Alaska | 0.0% |
| Chugach Census Area, Alaska | 0.0% |
| Copper River Census Area, Alaska | 0.0% |
| Denali Borough, Alaska | 0.0% |
| Dillingham Census Area, Alaska | 0.0% |
| Haines Borough, Alaska | 0.0% |
| Kodiak Island Borough, Alaska | 0.0% |
| Kusilvak Census Area, Alaska | 0.0% |
| Lake and Peninsula Borough, Alaska | 0.0% |
| Nome Census Area, Alaska | 0.0% |
| North Slope Borough, Alaska | 0.0% |
| Northwest Arctic Borough, Alaska | 0.0% |
| Petersburg Borough, Alaska | 0.0% |
| Prince of Wales-Hyder Census Area, Alaska | 0.0% |
| Sitka City and Borough, Alaska | 0.0% |
| Skagway Municipality, Alaska | 0.0% |
| Wrangell City and Borough, Alaska | 0.0% |
| Yakutat City and Borough, Alaska | 0.0% |
| Yukon-Koyukuk Census Area, Alaska | 0.0% |
| Hinsdale County, Colorado | 0.0% |
| Mineral County, Colorado | 0.0% |
How it sits next to wired service
On reach, licensed fixed wireless leads: 87.3% of locations, against 80.3% for cable and 62.6% for fiber. At 100/20 Mbps the order turns around. Wired service at that speed is reported at 92.3% of locations, licensed fixed wireless at 47.9%. T-Mobile and AT&T each report 100 Mbps1 as their fastest fixed wireless download anywhere in the country.
All of these are advertised maximums. The FCC data contain no measured speeds, no latency and no prices, and they cannot show how many customers share a wireless sector at a given address. Prices and plan terms belong to the provider's broadband facts label; whether an address qualifies belongs to the provider's own check, after the FCC's National Broadband Map shows who reports service there.
Questions about 5G home internet availability
Is 5G home internet available at my address?
Area figures cannot answer that. Search the address on the FCC's National Broadband Map, which lists each provider that reports service there, its technology and its fastest advertised speeds. The provider's own address check is the second step.
Is 5G home internet the same as fixed wireless?
It is one kind. The FCC files it under licensed fixed wireless (technology codes 71 and 72), together with 4G LTE home service and regional networks on licensed spectrum. Wireless service on unlicensed spectrum is a separate category (technology code 70), reported at 19.7%1 of US locations.
Which reaches more homes, 5G home internet or fiber?
Licensed fixed wireless is reported at 87.3% of US locations and fiber at 62.6%, as of June 30, 2026. At 100/20 Mbps the order reverses: wired service reaches 92.3% of locations at that speed, licensed fixed wireless 47.9%1.
Other technologies
Sources
- FCC, National Broadband Map, data as of June 30, 2026; Availability as of June 30, 2026; released November 10, 2026. broadbandmap.fcc.gov
- Census Bureau, Cartographic boundary file cb_2025_us_state_20m. www2.census.gov
- FCC, National Broadband Map, data as of June 30, 2022; Availability as of June 30, 2022; released May 10, 2024. broadbandmap.fcc.gov
- FCC, National Broadband Map, data as of December 31, 2025; Availability as of December 31, 2025; released November 3, 2026. broadbandmap.fcc.gov
- Census Bureau, Cartographic boundary file cb_2025_us_county_5m. www2.census.gov
How every figure is built: methodology. Found an error? Write to [email protected]; corrections are listed on the updates page.