Cable internet: where it reaches and who provides it
Cable is still the most widespread wired internet connection in the United States: providers report it at 80.3%1 of the homes and businesses the FCC counts, as of June 30, 2026. That share has barely moved since 2022, while fiber has grown around it. In much of the Plains and parts of the South, fiber now reaches more locations than cable does.
Data: FCC National Broadband Map, availability as of June 30, 2026 (file revision of November 10, 2026).
Source: FCC, National Broadband Map, data as of June 30, 2026; Census Bureau, Cartographic boundary file cb_2025_us_state_20m. Darker states are higher; DC is the dot. FCC file revision of November 10, 2026. Shares are of broadband serviceable locations (homes and businesses), not people.
Show the numbers
| State | Cable available |
|---|---|
| District of Columbia | 99.7% |
| Massachusetts | 97.4% |
| New Jersey | 97.2% |
| Connecticut | 97.0% |
| Maryland | 94.2% |
| Delaware | 93.3% |
| Hawaii | 91.3% |
| California | 90.5% |
| New York | 90.1% |
| Pennsylvania | 88.4% |
| Florida | 87.4% |
| Illinois | 86.6% |
| New Hampshire | 86.4% |
| Rhode Island | 85.6% |
| Washington | 83.8% |
| Ohio | 83.5% |
| Oregon | 82.5% |
| Utah | 82.0% |
| Michigan | 81.9% |
| Colorado | 81.9% |
| Georgia | 81.4% |
| North Carolina | 79.5% |
| Maine | 79.3% |
| Tennessee | 78.5% |
| Indiana | 78.0% |
| Virginia | 78.0% |
| Nevada | 77.9% |
| Louisiana | 77.4% |
| Texas | 77.0% |
| South Carolina | 75.0% |
| Minnesota | 70.9% |
| New Mexico | 70.8% |
| Alabama | 70.2% |
| Arizona | 69.8% |
| Kentucky | 69.1% |
| Kansas | 69.0% |
| Missouri | 68.1% |
| West Virginia | 67.7% |
| Wisconsin | 67.6% |
| Vermont | 66.9% |
| Idaho | 64.8% |
| Nebraska | 64.4% |
| Iowa | 62.5% |
| Arkansas | 60.3% |
| Wyoming | 59.9% |
| Oklahoma | 59.1% |
| Alaska | 57.6% |
| Mississippi | 56.0% |
| North Dakota | 54.2% |
| Montana | 52.0% |
| South Dakota | 50.7% |
How many homes and businesses can get cable
Cable internet is reported at 92.9 million of the 115.8 million broadband serviceable locations in the FCC's data, 80.3%, as of June 30, 2026 (FCC revision of November 10, 2026). No other wired technology reaches as many: fiber to the premises is reported at 62.6% and DSL over copper phone lines at 36.2%1.
"Reported" is the exact word. A location counts when a provider files with the FCC that it offers cable service there, or could install it within ten business days. The figure says nothing about who subscribes, and the Census Bureau's surveys do not separate cable subscriptions from fiber or DSL. The FCC records cable as technology code 40, which covers hybrid fiber-coaxial networks: a provider that runs fiber deep into its network but still uses coaxial cable to reach the building is counted as cable, not fiber. Our methodology sets out the full definitions.
Cable is most complete in dense, built-up places. It is reported at 99.7% of locations in the District of Columbia, 97.4% in Massachusetts, 97.2% in New Jersey and 97.0% in Connecticut. South Dakota has the lowest share, 50.7%, followed by Montana (52.0%) and North Dakota (54.2%1).
Cable internet providers
244 brands report cable service somewhere in the country, but two footprints are far larger than the rest. Xfinity reports cable at 38.0 million locations and Spectrum at 34.0 million, 32.8% and 29.4% of all US locations. Cox follows at 6.5 million, then Optimum (5.4 million) and Mediacom (2.6 million1). The rest are regional systems such as Sparklight, Breezeline and Midco, and smaller local operators.
| Xfinity | 37,980,036 | 32.8% | 41 | 2 Gbps |
|---|---|---|---|---|
| Spectrum | 34,023,975 | 29.4% | 42 | 1 Gbps |
| Cox | 6,480,640 | 5.6% | 20 | 2 Gbps |
| Optimum | 5,390,379 | 4.7% | 21 | 2 Gbps |
| Mediacom | 2,585,906 | 2.2% | 22 | 5 Gbps |
| Astound | 2,211,847 | 1.9% | 13 | 1.5 Gbps |
| Sparklight | 2,086,782 | 1.8% | 23 | 2 Gbps |
| WOW! | 1,586,751 | 1.4% | 6 | 2 Gbps |
| Breezeline | 1,233,296 | 1.1% | 13 | 2.5 Gbps |
| Midco | 525,984 | 0.5% | 5 | 2 Gbps |
| Vyve Broadband | 523,486 | 0.5% | 17 | 2 Gbps |
| Service Electric Cable TV | 423,473 | 0.4% | 2 | 2 Gbps |
Source: FCC, National Broadband Map, data as of June 30, 2026. Broadband serviceable locations in the 50 states and DC where the provider reports this technology, as of June 30, 2026.
Cable footprints are regional, so the provider depends on the place. Spectrum reports service in 41 states, Cox in 18 and WOW! in 61. Each state page and city page lists the providers reporting there.
Cable and fiber compared
On advertised download speed, cable reaches the gigabit range. Each of the largest cable companies files a top tier of at least 1 Gbps: 2 Gbps for Xfinity, 1 Gbps for Spectrum, 2.5 Gbps for Breezeline and 5 Gbps for Mediacom. Cable networks also file the FCC's 100/20 Mbps broadband benchmark almost without exception: Xfinity reports it at 37,980,036 of its 37,980,036 cable locations, Spectrum at 34,023,975 of 34,023,9751.
The FCC's gigabit tier also requires an upload of at least 100 Mbps. A 1 Gbps download is advertised at 91.0% of US locations, but gigabit service with that upload at only 72.3%; the locations in between have a gigabit download offer whose upload is below 100 Mbps. Wired service with at least 100 Mbps in both directions is reported at 73.7%1 of locations. Our methodology explains which tier each figure on this site uses. The FCC data do not cover latency, reliability or what a plan costs; prices belong to each provider's broadband facts label.
Four years without growth
Between June 30, 2022 and June 30, 2026, the share of locations with cable fell by 0.7 percentage points. Fiber rose 25.4 percentage points over the same period and DSL fell 18.6 percentage points1.
Source: FCC, National Broadband Map, data as of June 30, 2022; FCC, National Broadband Map, data as of December 31, 2025; FCC, National Broadband Map, data as of June 30, 2026. Shares of broadband serviceable locations in each FCC release (latest revision of each); the small number is the change in percentage points since June 30, 2022. The FCC's count of locations is updated with each release, so shares are compared rather than counts.
Show the numbers
| Measure | June 30, 2022 | December 31, 2025 | June 30, 2026 | Change (points) |
|---|---|---|---|---|
| Cable available | 81.0% | 80.5% | 80.3% | −0.7 pts |
| Fiber available | 37.2% | 59.9% | 62.6% | 25.4 pts |
| DSL available | 54.8% | 37.4% | 36.2% | −18.6 pts |
| Two or more wired choices | 36.7% | 53.6% | 55.6% | 18.9 pts |
The flat line does not mean the cable companies stood still. Several are building fiber networks, which the FCC records under code 50 rather than as cable. Since June 2022 Optimum's fiber count has changed by +951,800 locations, and it now reports fiber at 2.3 million locations against cable at 5.4 million. For Spectrum the change is +2,493,264 fiber locations, for Xfinity +1,099,749. Meanwhile the share of locations with two or more wired providers at 100/20 rose from 36.7%3 to 55.6%1: more locations now have a second wired network at that speed.
Where fiber now reaches more locations than cable
Nationally cable is ahead of fiber by a wide margin. In a band of Plains and Southern states, and in Rhode Island, it is the other way round. Fiber is reported at 80.3% of Nebraska's locations and cable at 64.4%; in Iowa the figures are 77.5% and 62.5%, in North Dakota 73.1% and 54.2%1.
| Rhode Island | 86.2% | 85.6% |
|---|---|---|
| Kansas | 81.3% | 69.0% |
| Tennessee | 80.5% | 78.5% |
| Nebraska | 80.3% | 64.4% |
| Iowa | 77.5% | 62.5% |
| North Dakota | 73.1% | 54.2% |
| Kentucky | 72.8% | 69.1% |
| Oklahoma | 71.5% | 59.1% |
| Mississippi | 71.2% | 56.0% |
| Missouri | 69.1% | 68.1% |
| Arkansas | 67.6% | 60.3% |
| South Dakota | 61.8% | 50.7% |
| United States | 62.6% | 80.3% |
Source: FCC, National Broadband Map, data as of June 30, 2026. FCC file revision of November 10, 2026. Shares are of broadband serviceable locations (homes and businesses), not people.
The county map shows the same divide at a finer grain: cable is reported at nearly every location in the most populous counties and at a minority of locations in many of the least populated ones.
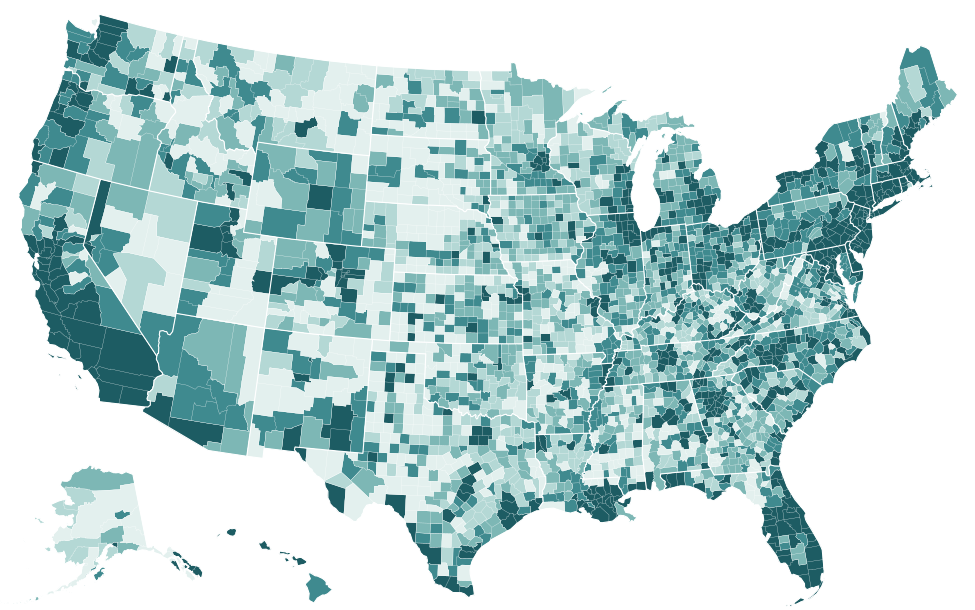
Source: FCC, National Broadband Map, data as of June 30, 2026; Census Bureau, Cartographic boundary file cb_2025_us_county_5m. FCC file revision of November 10, 2026. Shares are of broadband serviceable locations (homes and businesses), not people. The table lists the 25 highest and 25 lowest counties; every county is in the downloads.
Show the numbers
| County | Cable available |
|---|---|
| Philadelphia County, Pennsylvania | 99.8% |
| Charlottesville city, Virginia | 99.8% |
| Alexandria city, Virginia | 99.8% |
| Arlington County, Virginia | 99.8% |
| Colonial Heights city, Virginia | 99.8% |
| Suffolk County, Massachusetts | 99.8% |
| Ramsey County, Minnesota | 99.7% |
| District of Columbia, District of Columbia | 99.7% |
| Camden County, New Jersey | 99.7% |
| Delaware County, Pennsylvania | 99.6% |
| Winchester city, Virginia | 99.6% |
| Lexington city, Virginia | 99.6% |
| Martinsville city, Virginia | 99.6% |
| Middlesex County, Massachusetts | 99.5% |
| Cook County, Illinois | 99.5% |
| Manassas Park city, Virginia | 99.5% |
| Barnstable County, Massachusetts | 99.4% |
| Hopewell city, Virginia | 99.4% |
| Salem city, Virginia | 99.4% |
| Norfolk County, Massachusetts | 99.4% |
| Manassas city, Virginia | 99.4% |
| DuPage County, Illinois | 99.4% |
| DeKalb County, Georgia | 99.4% |
| Essex County, Massachusetts | 99.3% |
| Clayton County, Georgia | 99.3% |
| Monroe County, Arkansas | 0.0% |
| Perry County, Arkansas | 0.0% |
| Pike County, Arkansas | 0.0% |
| Searcy County, Arkansas | 0.0% |
| Woodruff County, Arkansas | 0.0% |
| Mariposa County, California | 0.0% |
| Trinity County, California | 0.0% |
| Baca County, Colorado | 0.0% |
| Bent County, Colorado | 0.0% |
| Cheyenne County, Colorado | 0.0% |
| Conejos County, Colorado | 0.0% |
| Costilla County, Colorado | 0.0% |
| Crowley County, Colorado | 0.0% |
| Custer County, Colorado | 0.0% |
| Dolores County, Colorado | 0.0% |
| Hinsdale County, Colorado | 0.0% |
| Jackson County, Colorado | 0.0% |
| Kiowa County, Colorado | 0.0% |
| Lincoln County, Colorado | 0.0% |
| Mineral County, Colorado | 0.0% |
| Ouray County, Colorado | 0.0% |
| Phillips County, Colorado | 0.0% |
| Saguache County, Colorado | 0.0% |
| San Juan County, Colorado | 0.0% |
| Washington County, Colorado | 0.0% |
States where the cable share fell
In most states the cable share changed by a few points or less since 2022. The exceptions are mostly in the West: Arizona's share fell 15.8 percentage points, Rhode Island's 13.0 percentage points, Nevada's 10.9 percentage points, Alaska's 10.1 percentage points and Oklahoma's 6.2 percentage points1. In each of them, the share of locations with fiber rose over the same period.
| State | Cable available (June 30, 2022) | Cable available | Cable available: change since June 30, 2022 | Fiber available: change since June 30, 2022 |
|---|---|---|---|---|
| Arizona | 85.6% | 69.8% | −15.8 pts | 27.2 pts |
| Rhode Island | 98.6% | 85.6% | −13.0 pts | 6.7 pts |
| Nevada | 88.8% | 77.9% | −10.9 pts | 22.2 pts |
| Alaska | 67.6% | 57.6% | −10.1 pts | 10.9 pts |
| Oklahoma | 65.4% | 59.1% | −6.2 pts | 35.7 pts |
Source: FCC, National Broadband Map, data as of June 30, 2022; FCC, National Broadband Map, data as of June 30, 2026. FCC file revision of November 10, 2026. Shares are of broadband serviceable locations (homes and businesses), not people.
The data record what providers filed, not why a filing changed. A state's cable share can fall when a provider files locations as fiber instead of cable, stops reporting an area, or when the FCC's list of locations changes. Cox reports service at 63.9% of Arizona's locations, 64.7% of Nevada's and 92.6% of Rhode Island's, and it now reports fiber at 15.4% of Arizona's locations and 11.1%1 of Nevada's. The Cox page has the detail.
When cable is the only wired option
Much of the country still has one wired choice at broadband speed. At 36.6% of US locations, 42.4 million, exactly one wired provider reports 100/20 Mbps. The two largest cable companies account for a large part of that: Spectrum is the only wired 100/20 provider at 12,749,844 locations and Xfinity at 12,657,596. In those places the alternatives are licensed fixed wireless, including 5G home internet, which is reported at 87.3%1 of US locations, or satellite.
The wired competition ranking shows how the share of locations with two or more wired choices varies by state.
Questions and answers
What is cable internet?
Internet service over a cable company's coaxial network. The FCC records it as technology code 40, which covers cable and hybrid fiber-coaxial networks, separate from fiber to the premises, code 50. A network with fiber in its backbone but coaxial cable to the building is counted as cable.
Which companies provide cable internet?
244 brands report cable service somewhere in the US. The two largest, Xfinity and Spectrum, report it at 32.8% and 29.4% of all US locations. Next come Cox, Optimum and Mediacom1.
Is cable internet slower than fiber?
The FCC data hold advertised maximum speeds, not measured ones. On download, the large cable networks advertise top tiers from 1 Gbps to 5 Gbps. The FCC's gigabit tier also sets an upload floor, and that is where the counts separate: a 1 Gbps download is advertised at 91.0% of US locations, but gigabit service with at least 100 Mbps upload at 72.3%1.
How do I find out which cable provider serves my address?
Search the address on the FCC's National Broadband Map. It lists each provider that reports service there with its technology and advertised speed. State and county shares cannot answer the question for a single address.
Other technologies
Sources
- FCC, National Broadband Map, data as of June 30, 2026; Availability as of June 30, 2026; released November 10, 2026. broadbandmap.fcc.gov
- Census Bureau, Cartographic boundary file cb_2025_us_state_20m. www2.census.gov
- FCC, National Broadband Map, data as of June 30, 2022; Availability as of June 30, 2022; released May 10, 2024. broadbandmap.fcc.gov
- FCC, National Broadband Map, data as of December 31, 2025; Availability as of December 31, 2025; released November 3, 2026. broadbandmap.fcc.gov
- Census Bureau, Cartographic boundary file cb_2025_us_county_5m. www2.census.gov
How every figure is built: methodology. Found an error? Write to [email protected]; corrections are listed on the updates page.