Fiber internet in the United States
Fiber to the premises is now reported at 62.6% of the homes and businesses the FCC counts, 72.5 million1 locations, as of June 30, 2026. Four years earlier the share was 37.2%2. The growth is uneven: in some states fiber is the norm, in others it is still the exception.
Data: FCC National Broadband Map, availability as of June 30, 2026 (file revision of November 10, 2026); NTIA, BEAD Final Proposal summaries.
Source: FCC, National Broadband Map, data as of June 30, 2026; Census Bureau, Cartographic boundary file cb_2025_us_state_20m. Darker states are higher; DC is the dot. FCC file revision of November 10, 2026. Shares are of broadband serviceable locations (homes and businesses), not people.
Show the numbers
| State | Fiber available |
|---|---|
| District of Columbia | 87.4% |
| Rhode Island | 86.2% |
| Hawaii | 82.7% |
| Connecticut | 82.1% |
| Kansas | 81.3% |
| Tennessee | 80.5% |
| Nebraska | 80.3% |
| Iowa | 77.5% |
| New Hampshire | 76.8% |
| Utah | 76.4% |
| Texas | 74.4% |
| North Dakota | 73.1% |
| Kentucky | 72.8% |
| Oklahoma | 71.5% |
| Mississippi | 71.2% |
| Indiana | 70.6% |
| Georgia | 70.3% |
| Virginia | 70.3% |
| New York | 70.0% |
| New Jersey | 69.7% |
| Maryland | 69.4% |
| Missouri | 69.1% |
| Florida | 68.4% |
| Arkansas | 67.6% |
| South Carolina | 67.4% |
| Alabama | 66.4% |
| Vermont | 65.9% |
| North Carolina | 65.3% |
| Maine | 62.8% |
| Minnesota | 62.6% |
| Pennsylvania | 62.0% |
| South Dakota | 61.8% |
| Louisiana | 61.7% |
| Colorado | 59.7% |
| Delaware | 59.2% |
| Ohio | 58.7% |
| Wyoming | 56.9% |
| Wisconsin | 55.9% |
| Oregon | 55.2% |
| Massachusetts | 54.5% |
| Illinois | 48.4% |
| California | 47.8% |
| West Virginia | 47.0% |
| Idaho | 46.5% |
| Nevada | 44.7% |
| Michigan | 42.6% |
| Montana | 42.5% |
| Arizona | 41.5% |
| Washington | 39.4% |
| New Mexico | 36.4% |
| Alaska | 17.1% |
What the map counts
A location counts as having fiber when at least one provider tells the FCC it offers fiber-to-the-premises service there, with installation possible within ten business days. It is a statement about the network, not about what anyone subscribes to: the Census Bureau's surveys cannot separate fiber subscriptions from cable or DSL. Shares are of the FCC's broadband serviceable locations (houses, apartment buildings and small businesses), with data as of June 30, 2026 in the FCC revision of November 10, 2026.
Where fiber is common, and where it is rare
Fiber is most widespread in the District of Columbia, at 87.4% of locations, followed by Rhode Island (86.2%) and Hawaii (82.7%). At the other end, fiber reaches 17.1% of locations in Alaska and 36.4% in New Mexico. In 401 of the 50 states and DC, fiber is available at half of all locations or more.
The county map shows the finer grain. Fiber is not simply an urban technology: many of the highest county shares are in rural North Dakota, South Dakota and Tennessee, while some large suburban counties are still mostly served by cable.
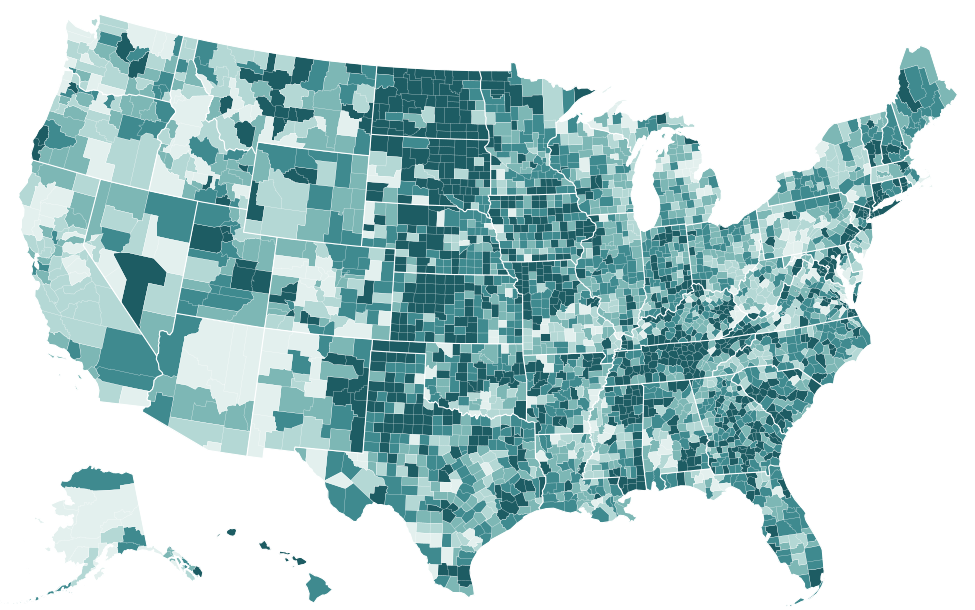
Source: FCC, National Broadband Map, data as of June 30, 2026; Census Bureau, Cartographic boundary file cb_2025_us_county_5m. FCC file revision of November 10, 2026. Shares are of broadband serviceable locations (homes and businesses), not people. The table lists the 25 highest and 25 lowest counties; every county is in the downloads.
Show the numbers
| County | Fiber available |
|---|---|
| Bacon County, Georgia | 100.0% |
| Winnebago County, Iowa | 100.0% |
| Graham County, Kansas | 100.0% |
| Ness County, Kansas | 100.0% |
| Osborne County, Kansas | 100.0% |
| Trego County, Kansas | 100.0% |
| Elliott County, Kentucky | 100.0% |
| McCreary County, Kentucky | 100.0% |
| Magoffin County, Kentucky | 100.0% |
| Menifee County, Kentucky | 100.0% |
| Morgan County, Kentucky | 100.0% |
| Wolfe County, Kentucky | 100.0% |
| Red Lake County, Minnesota | 100.0% |
| Boyd County, Nebraska | 100.0% |
| Adams County, North Dakota | 100.0% |
| Billings County, North Dakota | 100.0% |
| Bottineau County, North Dakota | 100.0% |
| Bowman County, North Dakota | 100.0% |
| Burke County, North Dakota | 100.0% |
| Cavalier County, North Dakota | 100.0% |
| Divide County, North Dakota | 100.0% |
| Eddy County, North Dakota | 100.0% |
| Foster County, North Dakota | 100.0% |
| Golden Valley County, North Dakota | 100.0% |
| Grant County, North Dakota | 100.0% |
| Braxton County, West Virginia | 0.3% |
| Gooding County, Idaho | 0.3% |
| Mineral County, Nevada | 0.3% |
| Franklin city, Virginia | 0.2% |
| Juneau City and Borough, Alaska | 0.2% |
| Washington County, Florida | 0.1% |
| Rio Blanco County, Colorado | 0.1% |
| Storey County, Nevada | 0.0% |
| Johnston County, Oklahoma | 0.0% |
| Love County, Oklahoma | 0.0% |
| Grand Isle County, Vermont | 0.0% |
| Monroe County, West Virginia | 0.0% |
| Kalawao County, Hawaii | 0.0% |
| Lewis County, Idaho | 0.0% |
| Woodson County, Kansas | 0.0% |
| Claiborne Parish, Louisiana | 0.0% |
| Nantucket County, Massachusetts | 0.0% |
| Keweenaw County, Michigan | 0.0% |
| Eureka County, Nevada | 0.0% |
| Wheeler County, Texas | 0.0% |
| Colonial Heights city, Virginia | 0.0% |
| Bristol Bay Borough, Alaska | 0.0% |
| Kusilvak Census Area, Alaska | 0.0% |
| Nome Census Area, Alaska | 0.0% |
| Yakutat City and Borough, Alaska | 0.0% |
How fast it is spreading
Between June 2022 and June 2026 the national share rose by 25.4 percentage points, and by 2.7 percentage points in the last six months of that span alone. The largest four-year gain among the states was in Maine (+48.4 percentage points), then Hawaii (+41.7 percentage points) and Wyoming (+41.3 percentage points1). The fiber growth ranking has every state.
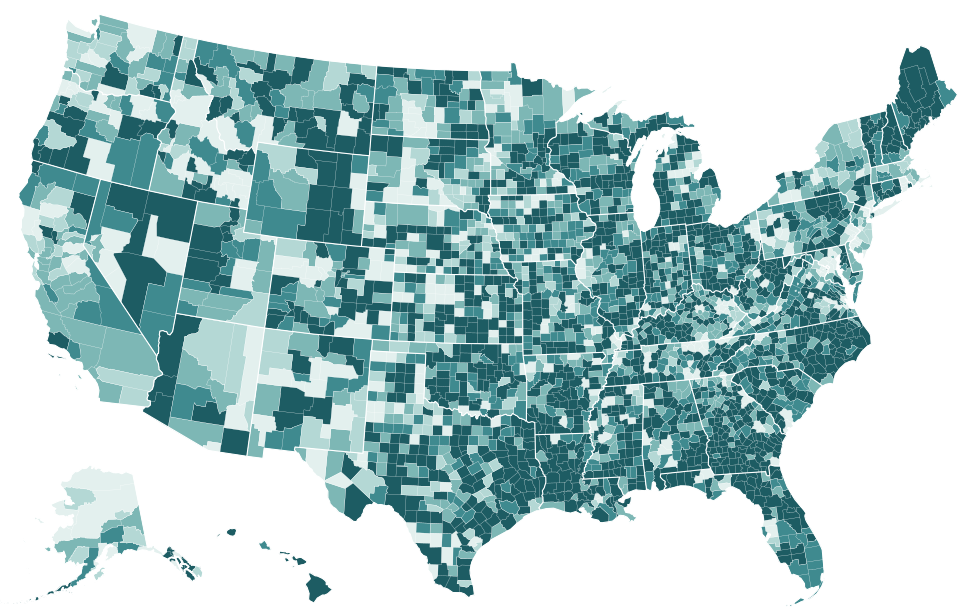
Source: FCC, National Broadband Map, data as of June 30, 2026; Census Bureau, Cartographic boundary file cb_2025_us_county_5m. FCC file revision of November 10, 2026. Shares are of broadband serviceable locations (homes and businesses), not people. The table lists the 25 highest and 25 lowest counties; every county is in the downloads.
Show the numbers
| County | Fiber available: change since June 30, 2022 |
|---|---|
| Dixie County, Florida | 99.0 pts |
| Gilchrist County, Florida | 98.7 pts |
| Marlboro County, South Carolina | 97.5 pts |
| Martinsville city, Virginia | 95.6 pts |
| Hancock County, Kentucky | 95.6 pts |
| Hickman County, Kentucky | 94.4 pts |
| Walthall County, Mississippi | 93.7 pts |
| Grady County, Georgia | 91.3 pts |
| Buena Vista city, Virginia | 91.1 pts |
| Stewart County, Georgia | 90.2 pts |
| Wibaux County, Montana | 89.8 pts |
| Galax city, Virginia | 89.8 pts |
| Newton County, Texas | 89.7 pts |
| Butler County, Kentucky | 89.6 pts |
| Yalobusha County, Mississippi | 89.6 pts |
| Lanier County, Georgia | 89.4 pts |
| Concordia Parish, Louisiana | 89.1 pts |
| Lincoln County, Colorado | 88.8 pts |
| Chowan County, North Carolina | 88.3 pts |
| Radford city, Virginia | 88.2 pts |
| Norfolk city, Virginia | 87.5 pts |
| Henderson County, Kentucky | 86.9 pts |
| Presque Isle County, Michigan | 86.7 pts |
| Hamilton County, Florida | 86.2 pts |
| Buchanan County, Missouri | 86.1 pts |
| Ogemaw County, Michigan | −7.7 pts |
| Douglas County, Washington | −7.8 pts |
| Mississippi County, Missouri | −7.8 pts |
| Norman County, Minnesota | −8.1 pts |
| Hitchcock County, Nebraska | −8.2 pts |
| Caribou County, Idaho | −8.6 pts |
| Tippah County, Mississippi | −8.7 pts |
| Winkler County, Texas | −9.1 pts |
| Valencia County, New Mexico | −9.1 pts |
| Grundy County, Tennessee | −9.2 pts |
| Boone County, Nebraska | −10.6 pts |
| Greeley County, Nebraska | −12.9 pts |
| Towns County, Georgia | −14.3 pts |
| Perkins County, Nebraska | −14.7 pts |
| Torrance County, New Mexico | −15.3 pts |
| Tazewell County, Virginia | −15.5 pts |
| Norton city, Virginia | −15.8 pts |
| Bannock County, Idaho | −17.0 pts |
| Dyer County, Tennessee | −19.3 pts |
| Bonneville County, Idaho | −20.8 pts |
| Warren County, Illinois | −21.1 pts |
| Indiana County, Pennsylvania | −23.0 pts |
| Mahoning County, Ohio | −24.6 pts |
| Wallace County, Kansas | −28.9 pts |
| Trumbull County, Ohio | −29.2 pts |
Who builds it
1,461 brands report fiber somewhere in the country. The largest footprint is AT&T's, at 23.5 million locations (20.3% of all US locations), followed by Verizon (9.5 million) and Frontier (6.9 million1). Below the national companies sit hundreds of regional telephone companies, cooperatives, municipal utilities and new fiber builders, which is why the count of fiber providers in a single state can run into the dozens.
| AT&T | 23,496,453 | 20.3% | 32 | 10 Gbps |
|---|---|---|---|---|
| Verizon | 9,507,593 | 8.2% | 11 | 2.3 Gbps |
| Frontier | 6,941,829 | 6.0% | 22 | 7 Gbps |
| Metronet | 2,888,142 | 2.5% | 21 | 5 Gbps |
| Spectrum | 2,667,691 | 2.3% | 41 | 1 Gbps |
| Optimum | 2,319,852 | 2.0% | 9 | 10 Gbps |
| Google Fiber | 2,032,716 | 1.8% | 16 | 8 Gbps |
| Brightspeed | 1,975,566 | 1.7% | 20 | 8 Gbps |
| Kinetic | 1,636,888 | 1.4% | 19 | 2 Gbps |
| Xfinity | 1,121,576 | 1.0% | 38 | 2 Gbps |
| Consolidated Communications | 1,113,335 | 1.0% | 18 | 8 Gbps |
| altafiber | 982,852 | 0.8% | 4 | 3 Gbps |
| TDS | 922,684 | 0.8% | 29 | 8 Gbps |
| Cox | 893,902 | 0.8% | 18 | 2 Gbps |
| T-Mobile | 823,663 | 0.7% | 13 | 5 Gbps |
Source: FCC, National Broadband Map, data as of June 30, 2026. Broadband serviceable locations in the 50 states and DC where the provider reports this technology, as of June 30, 2026.
Fiber in the largest cities
Large cities are better wired for fiber than the country as a whole. Across the 343 cities with 100,000 people or more, the median share of locations with fiber is 74.0%, and 258 of them have fiber at half of their locations or more. At the top of the list, Clarksville, Tennessee, Chattanooga, Tennessee and Lincoln, Nebraska are at 100.0%, 100.0% and 99.9%. At the bottom, fiber is reported at 0.0% of locations in New Bedford, Massachusetts, 0.5% in Cambridge, Massachusetts and 2.0% in Albany, New York1. The fiber ranking of cities lists all of them, with ties.
A second fiber network is still unusual
Where fiber exists, it usually comes from one company. Only 12.1%1 of US locations have two or more different fiber providers, though that is up from 3.1%2 in June 2022. A second fiber network laid where one already exists is called overbuild; the city pages show where it happens.
What fiber changes for a household
Two measures in the FCC data move with fiber. Upload speed: wired service with at least 100 Mbps in both directions is reported at 73.7% of locations, more than the 62.6% with fiber, because some cable networks now also file uploads of 100 Mbps. Multi-gigabit tiers: an advertised download of 2 Gbps or more is the fastest offer at 61.0%1 of locations, against 13.3%2 in June 2022, as fiber builders and some cable operators raised their top tiers.
What the data cannot say is how well a given network performs, what it costs or whether a building's wiring is ready. Those questions belong to the provider and, for prices, to its broadband facts label.
Fiber and the federal money
Fiber is also the main technology of the federal Broadband Equity, Access, and Deployment (BEAD) program. In the state final proposals summarized by NTIA, 2,368,238 of the 3,772,113 locations are assigned to fiber, 829,696 to low-Earth-orbit satellite and 499,1775 to fixed wireless; the BEAD ranking compares the states. Each state page shows its own plan's technology mix.
Questions and answers
What counts as fiber internet in the FCC data?
Only fiber to the premises, FCC technology code 50: a fiber line that runs into the home or building. Cable networks that use fiber in their backbone, sometimes marketed as fiber-powered, are counted as cable, and so are the shares on this page.
Is fiber faster than cable?
In what providers advertise, fiber's main difference is upload speed. A 1 Gbps download is advertised at 91.0% of US locations, but a gigabit offer with at least 100 Mbps upload at 72.3%1; the difference is mostly cable plans whose uploads stay below 100 Mbps. The FCC data contain advertised maximums only, not measured speeds.
How can I find out if fiber is available at my address?
Search the address on the FCC's National Broadband Map, which lists every provider that reports service there and the technology it uses. Area figures like the ones on this page cannot answer it for a single address.
Other technologies
Sources
- FCC, National Broadband Map, data as of June 30, 2026; Availability as of June 30, 2026; released November 10, 2026. broadbandmap.fcc.gov
- FCC, National Broadband Map, data as of June 30, 2022; Availability as of June 30, 2022; released May 10, 2024. broadbandmap.fcc.gov
- Census Bureau, Cartographic boundary file cb_2025_us_state_20m. www2.census.gov
- Census Bureau, Cartographic boundary file cb_2025_us_county_5m. www2.census.gov
- NTIA BroadbandUSA, BEAD Final Proposal Overview one-page PDFs. broadbandusa.ntia.gov
How every figure is built: methodology. Found an error? Write to [email protected]; corrections are listed on the updates page.