Fixed wireless internet in the United States
At least one provider reports fixed wireless internet at 89.2% of the homes and businesses the FCC counts, as of June 30, 2026, a wider reach than any wired technology. The label covers two different services: home internet from the national mobile carriers and the networks of 828 brands that report unlicensed fixed wireless, most of them regional. For 4.2 million1 locations, fixed wireless is the only way to get 100/20 Mbps without satellite.
Data: FCC National Broadband Map, availability as of June 30, 2026 (file revision of November 10, 2026); NTIA, BEAD Final Proposal summaries.
Source: FCC, National Broadband Map, data as of June 30, 2026; Census Bureau, Cartographic boundary file cb_2025_us_state_20m. Darker states are higher; DC is the dot. FCC file revision of November 10, 2026. Shares are of broadband serviceable locations (homes and businesses), not people.
Show the numbers
| State | Fixed wireless |
|---|---|
| Nevada | 99.1% |
| Utah | 97.1% |
| Arizona | 96.9% |
| Mississippi | 95.4% |
| Illinois | 95.3% |
| Colorado | 95.2% |
| Missouri | 94.5% |
| District of Columbia | 93.9% |
| Kansas | 93.7% |
| Idaho | 93.6% |
| New Mexico | 93.6% |
| Ohio | 93.6% |
| Nebraska | 93.6% |
| Texas | 93.4% |
| Indiana | 92.9% |
| Delaware | 92.8% |
| Vermont | 92.5% |
| Oklahoma | 92.4% |
| Iowa | 92.0% |
| Florida | 91.5% |
| California | 91.4% |
| Wyoming | 90.8% |
| Wisconsin | 90.2% |
| Minnesota | 88.9% |
| Maryland | 88.8% |
| Washington | 88.7% |
| Oregon | 88.7% |
| Pennsylvania | 88.2% |
| New Jersey | 88.1% |
| Michigan | 87.5% |
| Rhode Island | 86.7% |
| South Carolina | 86.4% |
| Tennessee | 86.4% |
| North Carolina | 85.8% |
| Georgia | 84.7% |
| New York | 84.5% |
| Massachusetts | 84.4% |
| Louisiana | 83.9% |
| Montana | 82.9% |
| Arkansas | 82.4% |
| Alabama | 81.9% |
| Connecticut | 81.4% |
| Kentucky | 81.0% |
| Virginia | 80.5% |
| New Hampshire | 79.7% |
| Maine | 78.0% |
| South Dakota | 76.3% |
| North Dakota | 75.5% |
| West Virginia | 68.2% |
| Hawaii | 66.1% |
| Alaska | 53.6% |
Where fixed wireless is reported
In the FCC's June 30, 2026 data (revision of November 10, 2026), 89.2% of US broadband serviceable locations (houses, apartment buildings and small businesses) have at least one fixed wireless provider. Cable reaches 80.3% and fiber 62.6%1. Reported means the provider tells the FCC it can install service within ten business days; it says nothing about subscriptions, and every listing can be challenged on the map.
In parts of the West the reach is nearly complete. 99.1% of locations in Nevada have a fixed wireless provider, 97.1% in Utah and 96.9% in Arizona. The lowest shares are in Alaska (53.6%), Hawaii (66.1%) and West Virginia (68.2%1).
Two services under one name
The FCC files fixed wireless under three codes, and the codes separate two kinds of provider.
Licensed fixed wireless (codes 71 and 72) uses spectrum licensed to the provider (code 71) or shared bands where users register under FCC rules, such as CBRS (code 72). It is reported at 87.3% of locations, led by the three national mobile carriers: T-Mobile at 81.5 million locations (70.4% of the US), Verizon at 62.5 million and AT&T at 37.4 million1. This is how they file 5G and LTE home internet, which has its own page: 5G home internet.
Unlicensed fixed wireless (code 70) uses spectrum that is not licensed to any single provider. It is reported at 19.7% of locations, by 8281 brands. The list is long and local: most of these brands serve a single region, and none reports code 70 service at more than a few percent of US locations.
The difference has a federal consequence. NTIA's BEAD notice of funding opportunity counts licensed fixed wireless as reliable broadband but not service over unlicensed spectrum. A home whose only offer of 25/3 Mbps or more comes from a local unlicensed network is therefore classed as unserved, whatever speed that network advertises (the methodology gives the full definitions).
The local wireless networks
The largest unlicensed provider, Rise Broadband, reports code 70 service at 3.1 million locations, 2.7% of the country, concentrated in Texas, Colorado and Utah. Next come unWired Broadband (1.3 million), TWN Communications (1.0 million), Nextlink Internet (862,000) and isp.net (758,0001).
The footprints also differ in advertised speed. Nextlink Internet advertises 100/20 Mbps or more on unlicensed spectrum at 772,732 of its 861,662 locations. Rise Broadband does so at 1,231,824 of 3,106,088, and TWN Communications at 0 of 1,020,4261. A provider's name on the map is not a speed promise; the advertised tier at the address is.
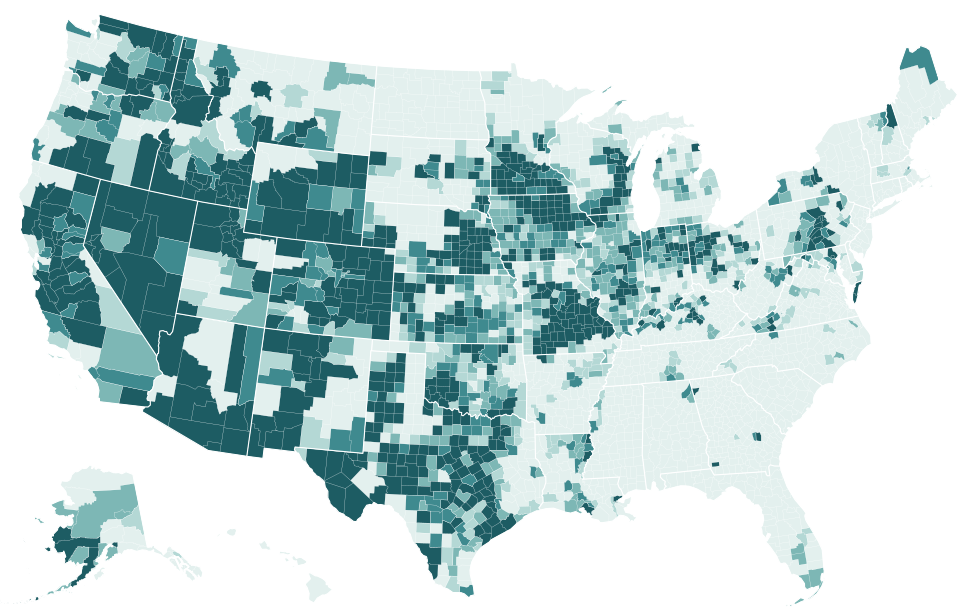
Source: FCC, National Broadband Map, data as of June 30, 2026; Census Bureau, Cartographic boundary file cb_2025_us_county_5m. FCC file revision of November 10, 2026. Shares are of broadband serviceable locations (homes and businesses), not people. The table lists the 25 highest and 25 lowest counties; every county is in the downloads.
Show the numbers
| County | Unlicensed fixed wireless |
|---|---|
| Miller County, Georgia | 100.0% |
| Cole County, Missouri | 100.0% |
| Crawford County, Missouri | 100.0% |
| Dent County, Missouri | 100.0% |
| Franklin County, Missouri | 100.0% |
| Gasconade County, Missouri | 100.0% |
| Greene County, Missouri | 100.0% |
| Iron County, Missouri | 100.0% |
| Maries County, Missouri | 100.0% |
| Miller County, Missouri | 100.0% |
| Morgan County, Missouri | 100.0% |
| Osage County, Missouri | 100.0% |
| Pulaski County, Missouri | 100.0% |
| Reynolds County, Missouri | 100.0% |
| Shannon County, Missouri | 100.0% |
| Stone County, Missouri | 100.0% |
| Washington County, Missouri | 100.0% |
| Webster County, Missouri | 100.0% |
| Carson City, Nevada | 100.0% |
| Glasscock County, Texas | 100.0% |
| Camden County, Missouri | 100.0% |
| Christian County, Missouri | 100.0% |
| Laclede County, Missouri | 100.0% |
| Phelps County, Missouri | 100.0% |
| Texas County, Missouri | 100.0% |
| Lee County, Arkansas | 0.0% |
| Little River County, Arkansas | 0.0% |
| Miller County, Arkansas | 0.0% |
| Montgomery County, Arkansas | 0.0% |
| Ouachita County, Arkansas | 0.0% |
| Pike County, Arkansas | 0.0% |
| Polk County, Arkansas | 0.0% |
| St. Francis County, Arkansas | 0.0% |
| Saline County, Arkansas | 0.0% |
| Sevier County, Arkansas | 0.0% |
| Union County, Arkansas | 0.0% |
| Alpine County, California | 0.0% |
| Del Norte County, California | 0.0% |
| Humboldt County, California | 0.0% |
| Mineral County, Colorado | 0.0% |
| San Juan County, Colorado | 0.0% |
| Capitol Planning Region, Connecticut | 0.0% |
| Greater Bridgeport Planning Region, Connecticut | 0.0% |
| Lower Connecticut River Valley Planning Region, Connecticut | 0.0% |
| Naugatuck Valley Planning Region, Connecticut | 0.0% |
| Northeastern Connecticut Planning Region, Connecticut | 0.0% |
| Northwest Hills Planning Region, Connecticut | 0.0% |
| South Central Connecticut Planning Region, Connecticut | 0.0% |
| Southeastern Connecticut Planning Region, Connecticut | 0.0% |
| Western Connecticut Planning Region, Connecticut | 0.0% |
The county map shows how regional these networks are. Unlicensed service covers 96.3% of locations in Nevada, where isp.net alone reports 69.5%, and 68.4% in Idaho, 66.1% in Utah and 66.5% in New Mexico. In Connecticut, New Jersey, Rhode Island and Hawaii no provider reports it at a measurable share (0.0%1).
Where fixed wireless is the only fast option
The measure that matters most for rural readers is not where fixed wireless exists but where nothing else reaches 100/20 Mbps. At 3.6% of US locations, 4,155,726 homes and businesses, a fixed wireless provider advertises 100/20 Mbps and no fiber, cable or DSL provider does. They are part of the 9.0 million locations without any wired 100/20 offer. At the other 4.8 million1, only satellite is advertised at that speed.
Wyoming has the highest share, 15.5% of its locations, followed by Idaho (13.2%), Alaska (11.6%), New Mexico (10.4%) and Montana (9.8%). By count, Texas leads with 682,038 such locations, then California (414,595) and Missouri (251,2651).
Source: FCC, National Broadband Map, data as of June 30, 2026. FCC file revision of November 10, 2026. Shares are of broadband serviceable locations (homes and businesses), not people.
Show the numbers
| State | Fixed wireless only at 100/20 |
|---|---|
| Wyoming | 15.5% |
| Idaho | 13.2% |
| Alaska | 11.6% |
| Mississippi | 11.1% |
| New Mexico | 10.4% |
| Missouri | 10.0% |
| Montana | 9.8% |
| Oklahoma | 9.7% |
| Arizona | 8.5% |
| Kansas | 6.9% |
| Nebraska | 6.7% |
| Texas | 6.6% |
| Colorado | 6.3% |
| Iowa | 6.2% |
| Wisconsin | 5.6% |
| United States | 3.6% |
What changed since 2022
Two trends run in opposite directions. The share of locations with any fixed wireless provider fell from 92.9% in June 2022 to 89.2%, and unlicensed service from 25.1% to 19.7%. Over the same four years, the share where a licensed fixed wireless offer reaches 100/20 Mbps went from 16.7%4 to 47.9%1. The footprint narrowed while the share of locations with a fast licensed offer more than doubled. The FCC filings record what providers report, not why a footprint shrank or grew.
Source: FCC, National Broadband Map, data as of June 30, 2022; FCC, National Broadband Map, data as of December 31, 2025; FCC, National Broadband Map, data as of June 30, 2026. Shares of broadband serviceable locations in each FCC release (latest revision of each); the small number is the change in percentage points since June 30, 2022. The FCC's count of locations is updated with each release, so shares are compared rather than counts.
Show the numbers
| Measure | June 30, 2022 | December 31, 2025 | June 30, 2026 | Change (points) |
|---|---|---|---|---|
| Fixed wireless | 92.9% | 88.7% | 89.2% | −3.7 pts |
| Licensed fixed wireless | 90.9% | 86.4% | 87.3% | −3.6 pts |
| Unlicensed fixed wireless | 25.1% | 21.2% | 19.7% | −5.5 pts |
| Fixed wireless 100/20 | 16.7% | 47.7% | 47.9% | 31.1 pts |
| Fixed wireless only at 100/20 | 2.6% | 3.7% | 3.6% | 1.0 pts |
The fixed-wireless-only share rose by 1.0 percentage points nationally, but a few states moved far more. In Mississippi it went from 0.4% to 11.1%; C Spire, the state's largest provider, reports service at 93.0% of Mississippi locations and 100/20 Mbps at 92.9%, while its fiber covers 17.2%; nearly all of the rest is licensed fixed wireless. New Mexico rose from 2.5% to 10.4% and Montana from 3.4% to 9.8%. Virginia moved the other way, from 4.5% to 1.5%, while its wired 100/20 coverage rose from 84.3%4 to 92.0%1.
What the map can and cannot tell you
Fixed wireless is the technology where an area figure says least about a single home. A provider reports the area it says it can serve; whether a given house qualifies is decided by the provider at sign-up, and the FCC data do not record that step. The data also hold only maximum advertised speeds, so they cannot compare fixed wireless with fiber or satellite on performance, and they contain no prices.
For an address, the FCC National Broadband Map is the starting point: it separates licensed from unlicensed providers and lists each one's advertised speed. A listing that is wrong can be challenged there.
Fixed wireless in the BEAD plans
In the final proposals states submitted to NTIA, 499,177 of the 3,772,113 locations in the plans are assigned to fixed wireless, against 2,368,238 to fiber and 829,696 to low-Earth-orbit satellite. Some plans lean on it heavily: Kansas assigns 67.5% of its BEAD locations to fixed wireless and Nebraska 56.9%6. Each state page shows its plan's technology mix.
Questions and answers
What is fixed wireless internet?
Home internet delivered by radio from a tower or rooftop to a receiver at the home, with no cable or phone line to the building. The FCC records it under three technology codes: 70 for unlicensed spectrum, 71 for licensed spectrum and 72 for licensed-by-rule spectrum such as the CBRS band. 5G and LTE home internet from mobile carriers is reported as licensed fixed wireless.
Is fixed wireless the same as 5G home internet?
5G home internet is one kind of fixed wireless. T-Mobile, Verizon and AT&T report their home internet service as licensed fixed wireless, and their footprints account for most of its reach. Local wireless internet providers, most of them on unlicensed spectrum, make up the rest. Our 5G home internet page covers the carriers' service.
How do I find fixed wireless internet near me?
Search your address on the FCC National Broadband Map. It lists every provider that reports service there, with the technology code, so licensed and unlicensed fixed wireless show up as separate entries. A provider listed there says it can install service within ten business days; the provider itself confirms eligibility for the address.
How fast is fixed wireless internet?
The FCC data hold only the maximum speeds providers advertise, not measured performance, so they cannot compare fixed wireless with fiber, cable or satellite on speed. What they show is where it is offered at 100/20 Mbps or more: licensed fixed wireless reaches that level at 47.9%1 of US locations, against 16.7%4 in June 2022.
Other technologies
Sources
- FCC, National Broadband Map, data as of June 30, 2026; Availability as of June 30, 2026; released November 10, 2026. broadbandmap.fcc.gov
- Census Bureau, Cartographic boundary file cb_2025_us_state_20m. www2.census.gov
- Census Bureau, Cartographic boundary file cb_2025_us_county_5m. www2.census.gov
- FCC, National Broadband Map, data as of June 30, 2022; Availability as of June 30, 2022; released May 10, 2024. broadbandmap.fcc.gov
- FCC, National Broadband Map, data as of December 31, 2025; Availability as of December 31, 2025; released November 3, 2026. broadbandmap.fcc.gov
- NTIA BroadbandUSA, BEAD Final Proposal Overview one-page PDFs. broadbandusa.ntia.gov
How every figure is built: methodology. Found an error? Write to [email protected]; corrections are listed on the updates page.