The US counties with the most unserved locations
In Kusilvak Census Area, Alaska, 100.0% of homes and businesses have no reliable broadband of even 25/3 Mbps, the highest share of any county. Nationally the figure is 2.4%, and the typical county sits at 2.9%1, in FCC data as of June 30, 2026.
Data: FCC National Broadband Map, availability as of June 30, 2026 (file revision of November 10, 2026); Census Bureau, American Community Survey 2020-2024 5-year estimates.
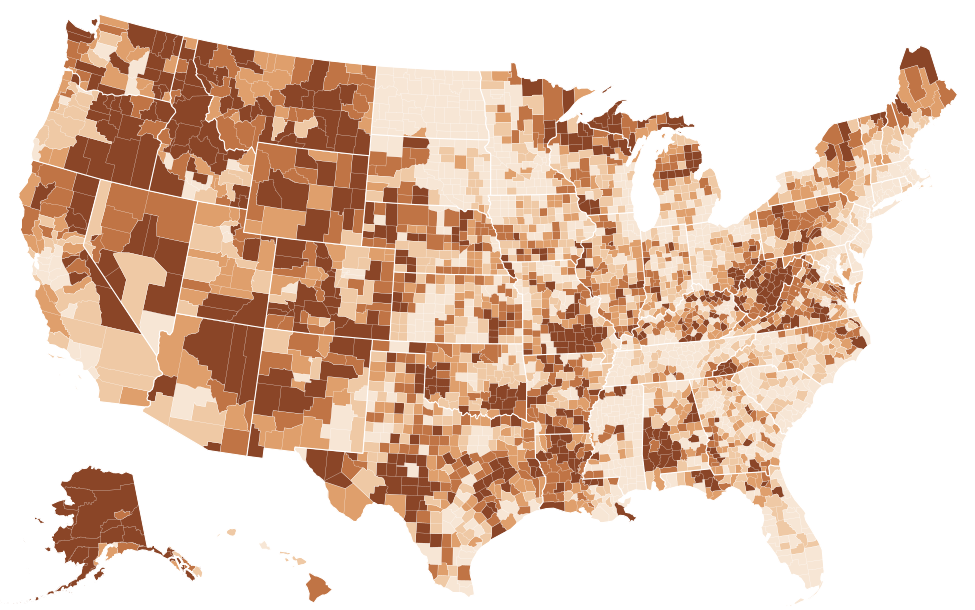
Source: FCC, National Broadband Map, data as of June 30, 2026; Census Bureau, Cartographic boundary file cb_2025_us_county_5m. FCC file revision of November 10, 2026. Shares are of broadband serviceable locations (homes and businesses), not people. The table lists the 25 highest and 25 lowest counties; every county is in the downloads.
Show the numbers
| County | Unserved |
|---|---|
| Kusilvak Census Area, Alaska | 100.0% |
| Yakutat City and Borough, Alaska | 100.0% |
| Bristol Bay Borough, Alaska | 98.2% |
| Eureka County, Nevada | 97.7% |
| Yukon-Koyukuk Census Area, Alaska | 96.2% |
| Esmeralda County, Nevada | 95.8% |
| Lake and Peninsula Borough, Alaska | 79.0% |
| Alpine County, California | 68.7% |
| Carter County, Missouri | 66.9% |
| Nome Census Area, Alaska | 65.8% |
| Park County, Colorado | 65.2% |
| Bethel Census Area, Alaska | 63.9% |
| Southeast Fairbanks Census Area, Alaska | 62.5% |
| Cameron Parish, Louisiana | 62.0% |
| Sierra County, California | 58.9% |
| Trinity County, California | 58.6% |
| Northwest Arctic Borough, Alaska | 57.4% |
| Dillingham Census Area, Alaska | 57.0% |
| Keweenaw County, Michigan | 56.6% |
| Kalawao County, Hawaii | 56.6% |
| Banner County, Nebraska | 55.5% |
| Ferry County, Washington | 55.5% |
| Boise County, Idaho | 54.9% |
| Shannon County, Missouri | 54.6% |
| Braxton County, West Virginia | 54.3% |
| Stutsman County, North Dakota | 0.0% |
| Towner County, North Dakota | 0.0% |
| Traill County, North Dakota | 0.0% |
| Walsh County, North Dakota | 0.0% |
| Ward County, North Dakota | 0.0% |
| Wells County, North Dakota | 0.0% |
| Horry County, South Carolina | 0.0% |
| Davison County, South Dakota | 0.0% |
| Harding County, South Dakota | 0.0% |
| Hyde County, South Dakota | 0.0% |
| Moody County, South Dakota | 0.0% |
| Sully County, South Dakota | 0.0% |
| Walworth County, South Dakota | 0.0% |
| DeKalb County, Tennessee | 0.0% |
| Fentress County, Tennessee | 0.0% |
| Grundy County, Tennessee | 0.0% |
| Hamblen County, Tennessee | 0.0% |
| Jackson County, Tennessee | 0.0% |
| Lake County, Tennessee | 0.0% |
| Montgomery County, Tennessee | 0.0% |
| Overton County, Tennessee | 0.0% |
| Bailey County, Texas | 0.0% |
| Lexington city, Virginia | 0.0% |
| Marion County, Alabama | 0.0% |
| San Francisco County, California | 0.0% |
On the FCC National Broadband Map as of June 30, 2026 (revision of November 10, 2026), Kusilvak Census Area, Alaska is the only ranked county where every location is unserved: 100.0%. Four more are above nine-tenths: Bristol Bay Borough, Alaska (98.2%), Eureka County, Nevada (97.7%), Yukon-Koyukuk Census Area, Alaska (96.2%) and Esmeralda County, Nevada (95.8%). After them the shares drop steeply, to 79.0% in Lake and Peninsula Borough, Alaska and 65.2% in Park County, Colorado, the tenth. In all, 34 counties have half or more of their homes and businesses unserved, while the median county has 2.9%1.
| 1 | Kusilvak Census Area, Alaska | 100.0% | 2,926 | 0.0% | 17.7% |
|---|---|---|---|---|---|
| 2 | Bristol Bay Borough, Alaska | 98.2% | 1,046 | 0.0% | 15.4% |
| 3 | Eureka County, Nevada | 97.7% | 1,145 | 0.0% | 7.1% |
| 4 | Yukon-Koyukuk Census Area, Alaska | 96.2% | 5,944 | 0.1% | 35.1% |
| 5 | Esmeralda County, Nevada | 95.8% | 812 | 0.5% | 18.6% |
| 6 | Lake and Peninsula Borough, Alaska | 79.0% | 2,014 | 21.1% | 32.0% |
| 7 | Alpine County, California | 68.7% | 841 | 20.6% | 34.0% |
| 8 | Carter County, Missouri | 66.9% | 2,243 | 8.8% | 40.3% |
| 9 | Nome Census Area, Alaska | 65.8% | 2,771 | 29.1% | 18.1% |
| 10 | Park County, Colorado | 65.2% | 9,684 | 14.1% | 9.5% |
| 11 | Bethel Census Area, Alaska | 63.9% | 4,163 | 36.1% | 9.0% |
| 12 | Southeast Fairbanks Census Area, Alaska | 62.5% | 3,439 | 13.1% | 41.9% |
| 13 | Cameron Parish, Louisiana | 62.0% | 2,394 | 62.2% | 1.6% |
| 14 | Sierra County, California | 58.9% | 1,228 | 28.3% | 25.7% |
| 15 | Trinity County, California | 58.6% | 4,533 | 11.1% | 27.6% |
| 16 | Northwest Arctic Borough, Alaska | 57.4% | 1,670 | 42.6% | 5.7% |
| 17 | Dillingham Census Area, Alaska | 57.0% | 1,448 | 43.0% | 25.4% |
| 18 | Keweenaw County, Michigan | 56.6% | 1,353 | 29.9% | 35.6% |
| 19 | Ferry County, Washington | 55.5% | 2,532 | 12.1% | 26.1% |
| 20 | Boise County, Idaho | 54.9% | 3,388 | 16.3% | 33.9% |
| 21 | Shannon County, Missouri | 54.6% | 2,373 | 21.0% | 0.0% |
| 22 | Braxton County, West Virginia | 54.3% | 4,130 | 33.8% | 31.4% |
| 23 | Aleutians West Census Area, Alaska | 53.8% | 660 | 46.2% | 25.6% |
| 24 | East Feliciana Parish, Louisiana | 53.0% | 4,533 | 28.1% | 27.7% |
| 25 | Lewis County, Idaho | 52.5% | 1,242 | 0.0% | 6.0% |
| 26 | Monroe County, West Virginia | 52.5% | 4,483 | 17.5% | 23.5% |
| 27 | Roger Mills County, Oklahoma | 52.0% | 1,428 | 21.9% | 2.8% |
| 28 | Garfield County, Montana | 51.7% | 485 | 45.0% | 36.8% |
| 29 | Lake County, Oregon | 51.7% | 2,540 | 35.9% | 20.4% |
| 30 | Harmon County, Oklahoma | 51.4% | 1,022 | 7.8% | 4.3% |
| 31 | Lincoln County, Washington | 51.0% | 3,932 | 28.8% | 13.6% |
| 32 | Forest County, Pennsylvania | 50.6% | 3,518 | 35.4% | 30.4% |
| 33 | Wheeler County, Oregon | 50.6% | 552 | 46.6% | 44.9% |
| 34 | Rappahannock County, Virginia | 50.3% | 2,162 | 41.9% | 33.5% |
| 35 | Sumter County, Alabama | 49.3% | 3,424 | 35.1% | 32.6% |
| 36 | Okanogan County, Washington | 48.1% | 11,376 | 32.6% | 15.3% |
| 37 | Modoc County, California | 48.0% | 2,571 | 33.2% | 26.6% |
| 38 | Perry County, Alabama | 48.0% | 2,400 | 39.7% | 33.2% |
| 39 | Roane County, West Virginia | 47.5% | 3,915 | 35.5% | 23.2% |
| 40 | San Augustine County, Texas | 47.3% | 2,470 | 34.3% | 9.6% |
| 41 | Claiborne Parish, Louisiana | 47.0% | 3,467 | 38.6% | 20.1% |
| 42 | Patrick County, Virginia | 46.8% | 5,186 | 37.2% | 7.2% |
| 43 | Idaho County, Idaho | 46.4% | 5,148 | 4.1% | 12.8% |
| 44 | Reynolds County, Missouri | 46.1% | 1,985 | 44.5% | 0.0% |
| 45 | Wilcox County, Alabama | 45.7% | 2,500 | 32.7% | 25.8% |
| 46 | Catron County, New Mexico | 45.6% | 1,712 | 12.8% | 34.6% |
| 47 | Newton County, Arkansas | 45.5% | 2,623 | 4.4% | 12.6% |
| 48 | Camas County, Idaho | 45.3% | 423 | 32.4% | 18.4% |
| 49 | Clay County, West Virginia | 45.0% | 1,956 | 39.4% | 26.7% |
| 50 | Denali Borough, Alaska | 44.9% | 855 | 22.6% | 26.8% |
| 51 | San Juan County, Washington | 44.9% | 5,502 | 40.5% | 12.5% |
| 52 | Craig County, Virginia | 44.7% | 1,363 | 20.9% | 6.9% |
| 53 | Gilliam County, Oregon | 44.7% | 605 | 42.4% | 17.5% |
| 54 | Prince of Wales-Hyder Census Area, Alaska | 44.1% | 1,900 | 35.5% | 28.5% |
| 55 | Calhoun County, West Virginia | 44.0% | 1,619 | 51.0% | 34.8% |
| 56 | Tensas Parish, Louisiana | 43.8% | 1,517 | 48.7% | 7.8% |
| =57 | Cleburne County, Alabama | 43.3% | 3,055 | 23.7% | 10.7% |
| =57 | Jackson County, Colorado | 43.3% | 553 | 36.5% | 26.7% |
| 59 | Summers County, West Virginia | 42.4% | 3,388 | 37.9% | 15.1% |
| 60 | Mariposa County, California | 42.2% | 4,101 | 15.7% | 15.5% |
| 61 | Barbour County, West Virginia | 42.1% | 3,631 | 49.7% | 22.1% |
| 62 | Skamania County, Washington | 41.9% | 2,449 | 43.9% | 17.1% |
| 63 | Latimer County, Oklahoma | 41.9% | 2,378 | 51.9% | 5.1% |
| 64 | Caldwell Parish, Louisiana | 41.6% | 2,174 | 42.4% | 23.1% |
| 65 | Edwards County, Texas | 41.5% | 1,278 | 38.9% | 15.0% |
| 66 | Sioux County, Nebraska | 41.4% | 414 | 36.0% | 31.4% |
| 67 | Catahoula Parish, Louisiana | 41.2% | 2,195 | 40.5% | 24.3% |
| 68 | Ripley County, Missouri | 41.0% | 2,524 | 36.2% | 17.5% |
| 69 | Powder River County, Montana | 40.9% | 436 | 53.1% | 13.5% |
| 70 | Owyhee County, Idaho | 40.9% | 2,179 | 31.8% | 13.2% |
| 71 | Conecuh County, Alabama | 40.6% | 2,946 | 25.3% | 23.2% |
| 72 | Klickitat County, Washington | 40.3% | 4,774 | 42.7% | 19.4% |
| 73 | Bland County, Virginia | 39.9% | 1,511 | 49.4% | 16.1% |
| 74 | Graham County, North Carolina | 39.8% | 2,192 | 54.6% | 26.9% |
| 75 | Warren County, Indiana | 39.2% | 1,835 | 43.6% | 11.7% |
| 76 | Wayne County, Missouri | 39.1% | 2,885 | 43.1% | 23.7% |
| 77 | Bonner County, Idaho | 39.0% | 10,938 | 34.4% | 7.1% |
| 78 | Benewah County, Idaho | 38.7% | 2,150 | 29.4% | 10.3% |
| 79 | Menard County, Texas | 38.6% | 862 | 32.6% | 6.0% |
| 80 | Lowndes County, Alabama | 38.4% | 2,001 | 44.5% | 17.3% |
| 81 | Mason County, Texas | 38.3% | 1,322 | 43.7% | 13.9% |
| 82 | Lunenburg County, Virginia | 38.0% | 2,579 | 49.9% | 12.0% |
| 83 | Burleson County, Texas | 37.7% | 4,338 | 27.3% | 8.2% |
| 84 | Union Parish, Louisiana | 37.3% | 4,477 | 43.3% | 20.8% |
| 85 | Kimble County, Texas | 37.0% | 1,426 | 37.5% | 8.7% |
| 86 | Washburn County, Wisconsin | 36.6% | 5,013 | 42.7% | 9.8% |
| 87 | Teller County, Colorado | 36.3% | 4,925 | 44.9% | 7.3% |
| 88 | Las Animas County, Colorado | 36.2% | 3,206 | 52.5% | 18.6% |
| 89 | Pope County, Illinois | 35.8% | 1,080 | 56.4% | 18.2% |
| 90 | Chautauqua County, Kansas | 35.7% | 929 | 24.6% | 8.4% |
| 91 | Amelia County, Virginia | 35.5% | 2,293 | 34.5% | 8.1% |
| 92 | Washington County, Alabama | 35.3% | 3,411 | 51.5% | 13.9% |
| 93 | Grayson County, Virginia | 35.2% | 3,649 | 48.2% | 6.4% |
| 94 | Tyler County, West Virginia | 35.1% | 1,835 | 53.4% | 22.0% |
| 95 | Benton County, Mississippi | 34.8% | 1,627 | 55.5% | 22.3% |
| 96 | Rio Blanco County, Colorado | 34.6% | 1,161 | 53.9% | 25.7% |
| 97 | Stevens County, Washington | 34.6% | 8,626 | 35.2% | 7.3% |
| 98 | Iron County, Missouri | 34.1% | 1,821 | 46.7% | 0.0% |
| 99 | Morrow County, Oregon | 33.8% | 1,789 | 49.9% | 11.9% |
| 100 | Clarke County, Alabama | 33.6% | 4,378 | 41.7% | 13.5% |
Source: FCC, National Broadband Map, data as of June 30, 2026. Rank 1 is the highest value; "=" marks a tie at the displayed precision. FCC file revision of November 10, 2026. Shares are of broadband serviceable locations (homes and businesses), not people.
What the county figure counts
Each figure is a share of a county's broadband serviceable locations: houses, apartment buildings and small businesses, each counted once. A location is unserved under the rules of the federal Broadband Equity, Access, and Deployment (BEAD) program when no provider reports reliable service of at least 25 Mbps download and 3 Mbps upload there. Reliable means fiber, cable, DSL or licensed fixed wireless reported as low-latency. Satellite and unlicensed fixed wireless do not make a location served, however fast the advertised plan.
The ranking leaves out the smallest county equivalents, whose shares can swing with a handful of buildings. Yakutat City and Borough in Alaska is one: all 4171 of its locations are unserved, and at every one of them satellite is the only service reported. The other columns of the table show how many locations each share stands for, what share has wired service of 100/20 Mbps, and where satellite is the only option.
Three different gaps behind the same label
Counties near the top of the ranking reach it in different ways, and the difference matters for anyone living there. The FCC data separate three situations.
Slow terrestrial service. In Kusilvak Census Area, Alaska, 1 terrestrial provider reports service: GCI, over DSL and unlicensed fixed wireless, at 82.3% of locations, with a fastest advertised download of 10 Mbps. In Bristol Bay Borough, Alaska, Bristol Bay Telephone Cooperative Inc reports DSL at 84.6% of locations, advertised at up to 25 Mbps1. Neither county has fiber at any location.
Wireless service the definition does not count. In Eureka County, Nevada, Hot Spot Broadband Inc reports unlicensed fixed wireless at 91.9% of locations, and advertises 100/20 Mbps at all of them; the county is still 97.7% unserved. Shannon County, Missouri is a sharper case: unlicensed fixed wireless is reported at 100.0% of locations and satellite-only locations are 0.0%, yet 54.6% are unserved. Park County, Colorado, tenth in the ranking, has unlicensed fixed wireless at 71.9%1 of locations.
No ground network at all. Elsewhere the gap is satellite-only locations. In Carter County, Missouri, 40.3% of locations have no wired or fixed wireless provider of any kind; in Wheeler County, Oregon the share is 44.9%, the highest of any ranked county, in Rappahannock County, Virginia 33.5%, in Braxton County, West Virginia 31.4% and in Forest County, Pennsylvania 30.4%. Across the US the satellite-only share is 0.8%1.
| Kusilvak Census Area, Alaska | 100.0% | 16.2% | 75.7% | 0.0% | 17.7% |
|---|---|---|---|---|---|
| Bristol Bay Borough, Alaska | 98.2% | 84.6% | 0.0% | 0.0% | 15.4% |
| Eureka County, Nevada | 97.7% | 22.1% | 91.9% | 3.7% | 7.1% |
| Shannon County, Missouri | 54.6% | 28.7% | 100.0% | 55.1% | 0.0% |
| Park County, Colorado | 65.2% | 44.8% | 71.9% | 28.1% | 9.5% |
| Carter County, Missouri | 66.9% | 21.5% | 2.4% | 45.7% | 40.3% |
| Wheeler County, Oregon | 50.6% | 0.9% | 36.0% | 25.7% | 44.9% |
| Rappahannock County, Virginia | 50.3% | 27.4% | 0.5% | 47.2% | 33.5% |
| Braxton County, West Virginia | 54.3% | 24.2% | 2.9% | 49.9% | 31.4% |
Source: FCC, National Broadband Map, data as of June 30, 2026. FCC file revision of November 10, 2026. Shares are of broadband serviceable locations (homes and businesses), not people.
The table shows why "unserved" is not the same as "offline". Licensed fixed wireless, the category that includes 5G home internet, is reported at 55.1% of Shannon County's locations and 49.9%1 of Braxton County's, but a listing counts toward "served" only where it is low-latency and reaches 25/3 Mbps at that location.
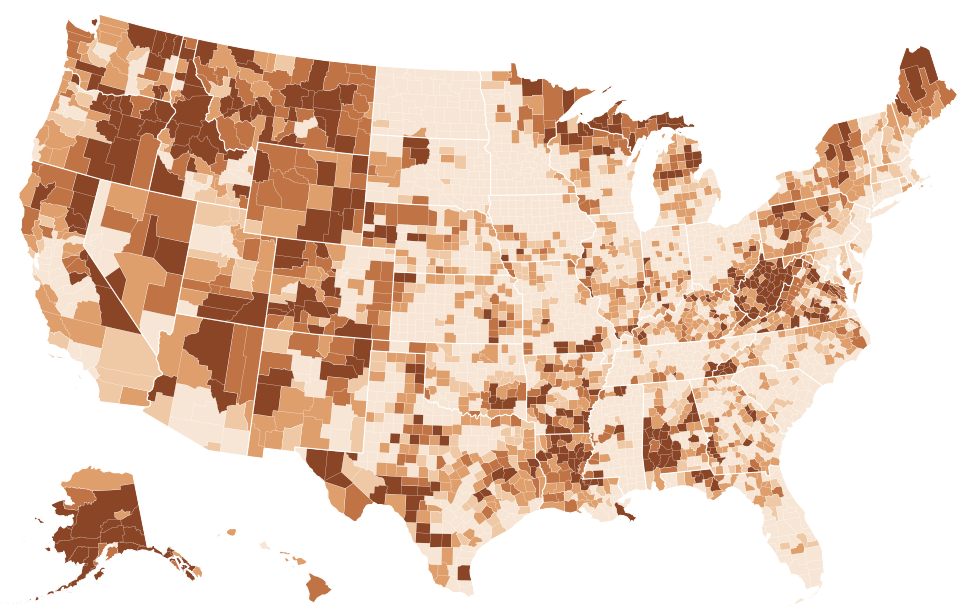
Source: FCC, National Broadband Map, data as of June 30, 2026; Census Bureau, Cartographic boundary file cb_2025_us_county_5m. FCC file revision of November 10, 2026. Shares are of broadband serviceable locations (homes and businesses), not people. The table lists the 25 highest and 25 lowest counties; every county is in the downloads.
Show the numbers
| County | Satellite only |
|---|---|
| Yakutat City and Borough, Alaska | 100.0% |
| Kalawao County, Hawaii | 56.6% |
| Wheeler County, Oregon | 44.9% |
| Southeast Fairbanks Census Area, Alaska | 41.9% |
| Carter County, Missouri | 40.3% |
| Garfield County, Montana | 36.8% |
| Keweenaw County, Michigan | 35.6% |
| Yukon-Koyukuk Census Area, Alaska | 35.1% |
| Calhoun County, West Virginia | 34.8% |
| Catron County, New Mexico | 34.6% |
| Alpine County, California | 34.0% |
| Boise County, Idaho | 33.9% |
| Rappahannock County, Virginia | 33.5% |
| Perry County, Alabama | 33.2% |
| Sumter County, Alabama | 32.6% |
| Petroleum County, Montana | 32.6% |
| Lake and Peninsula Borough, Alaska | 32.0% |
| Sioux County, Nebraska | 31.4% |
| Braxton County, West Virginia | 31.4% |
| Forest County, Pennsylvania | 30.4% |
| Prince of Wales-Hyder Census Area, Alaska | 28.5% |
| East Feliciana Parish, Louisiana | 27.7% |
| Trinity County, California | 27.6% |
| St. Helena Parish, Louisiana | 27.5% |
| Graham County, North Carolina | 26.9% |
| Bailey County, Texas | 0.0% |
| Glasscock County, Texas | 0.0% |
| Hardeman County, Texas | 0.0% |
| Lynn County, Texas | 0.0% |
| Parmer County, Texas | 0.0% |
| Terry County, Texas | 0.0% |
| Wichita County, Texas | 0.0% |
| Alexandria city, Virginia | 0.0% |
| Bristol city, Virginia | 0.0% |
| Emporia city, Virginia | 0.0% |
| Fairfax city, Virginia | 0.0% |
| Falls Church city, Virginia | 0.0% |
| Lexington city, Virginia | 0.0% |
| Manassas city, Virginia | 0.0% |
| Norton city, Virginia | 0.0% |
| Winchester city, Virginia | 0.0% |
| Marion County, Alabama | 0.0% |
| Greene County, Arkansas | 0.0% |
| Sacramento County, California | 0.0% |
| San Francisco County, California | 0.0% |
| Sutter County, California | 0.0% |
| Broomfield County, Colorado | 0.0% |
| Denver County, Colorado | 0.0% |
| Phillips County, Colorado | 0.0% |
| Greater Bridgeport Planning Region, Connecticut | 0.0% |
Where the unserved locations are, by number
Sorted by count, the list changes: it mixes large metropolitan counties with small shares and rural counties with large ones. San Diego County, California has 17,950 unserved locations, more than any other county, which is 2.3% of its 783,000 locations. Riverside County, California follows with 13,023 (1.7%), and Maricopa County, Arizona has 11,082, only 0.7% of its locations. A small share of a very large county can exceed every location in a remote one: Kusilvak Census Area, Alaska has 2,9261 locations in total.
St. Louis County, Minnesota, third by count with 11,843, sits between the two groups at 11.8%. A few counties are high on both lists: Okanogan County, Washington has 11,376, 48.1%; Bonner County, Idaho 10,938, 39.0%; and Park County, Colorado 9,684, 65.2%1. For these places the size of the gap and its depth coincide.
Source: FCC, National Broadband Map, data as of June 30, 2026. FCC file revision of November 10, 2026. Shares are of broadband serviceable locations (homes and businesses), not people.
Show the numbers
| County | Unserved (locations) |
|---|---|
| San Diego County, California | 17,950 |
| Riverside County, California | 13,023 |
| St. Louis County, Minnesota | 11,843 |
| San Bernardino County, California | 11,380 |
| Okanogan County, Washington | 11,376 |
| Maricopa County, Arizona | 11,082 |
| Bonner County, Idaho | 10,938 |
| Pima County, Arizona | 10,079 |
| Park County, Colorado | 9,684 |
| Matanuska-Susitna Borough, Alaska | 9,429 |
| Lewis County, Washington | 8,728 |
| Stevens County, Washington | 8,626 |
| Navajo County, Arizona | 8,491 |
| Shasta County, California | 8,428 |
| Clark County, Washington | 7,680 |
Alaska, the interior West and the Appalachian and Ozark hills
The national map shows where high shares cluster. Alaska has 11 of its 302 boroughs and census areas at half or more, while Anchorage is at 0.8%. In the interior West the high counties are large and thinly settled: two of the top five are in Nevada, and Alpine County, California (68.7%1) and Park County, Colorado follow. Further east, several of the counties above half are in the hills of Missouri, West Virginia, Virginia and Pennsylvania, and in most of those satellite-only locations account for a large part of the gap.
Texas, with 2542 counties, has more counties with a quarter or more of their locations unserved than any other state, though none of them is above half. State pages carry a county map and a full county table: Alaska, Nevada, Missouri, West Virginia and Texas are the places to start.
Counties where the gap closed, and where it grew
County shares have moved much more than the national one, which fell by 5.0 percentage points between June 30, 2022 and June 30, 2026. The largest county decline is in Stewart County, Georgia: its unserved share fell by 88.5 percentage points, to 8.4%, and Kinetic now reports fiber at 90.2% of its locations. Echols County, Georgia fell by 87.3 percentage points. In Mississippi, Jefferson County fell by 86.5 percentage points and Amite County by 86.0 percentage points; in both, C Spire is now the largest provider, offering 100/20 Mbps or more at 94.3% and 91.2%1 of locations.
A smaller number of counties moved the other way. Newton County, Arkansas rose by 40.2 percentage points, to 45.5%; its largest provider reports DSL advertised at up to 25 Mbps. The Nome Census Area in Alaska rose by 19.6 percentage points, to 65.8%1. The data record that the listings changed, not why: a provider's corrected filing, a successful challenge or a change in how a service is reported can each move a county's share.
These comparisons use shares, not counts. The FCC's list of locations is revised with each release, so a county's number of unserved locations can change even where no network was built.
Unserved on the map, subscribed in the survey
The Census Bureau's American Community Survey asks households what they subscribe to, including cellular data plans and satellite, which the BEAD definition sets aside. In Kusilvak Census Area, Alaska, unserved at every location on the FCC map, 82.5% of households reported a broadband subscription of some kind in 2020–2024 (margin of error ±3.0 percentage points), and 48.6% relied only on a cellular data plan (±3.6 percentage points). In Yukon-Koyukuk Census Area, Alaska1, 64.2% had a subscription (±3.3 percentage points) and 35.6% a satellite subscription (±5.8 percentage points3).
| Area | Unserved | Households with a broadband subscription of any type | Households relying only on a cellular data plan | Households with satellite internet |
|---|---|---|---|---|
| Kusilvak Census Area, Alaska | 100.0% | 82.5% ±3.0 | 48.6% ±3.6 | 23.0% ±2.7 |
| Yukon-Koyukuk Census Area, Alaska | 96.2% | 64.2% ±3.3 | 16.0% ±3.4 | 35.6% ±5.8 |
| Eureka County, Nevada | 97.7% | 90.2% ±9.7 | 21.4% ±13.9 | 19.9% ±8.7 |
| Carter County, Missouri | 66.9% | 83.1% ±4.5 | 22.9% ±6.6 | 13.3% ±5.6 |
| Braxton County, West Virginia | 54.3% | 79.8% ±4.5 | 9.3% ±1.6 | 17.7% ±4.7 |
| Forest County, Pennsylvania | 50.6% | 74.8% ±3.6 | 13.3% ±2.4 | 11.7% ±2.0 |
Source: FCC, National Broadband Map, data as of June 30, 2026; Census Bureau, American Community Survey 2020-2024 5-year detailed tables. FCC file revision of November 10, 2026. Shares are of broadband serviceable locations (homes and businesses), not people. ± is the 90% margin of error.
The two sources measure different things over different periods: the FCC counts locations as of June 30, 2026, the survey households over five years. Small counties carry wide margins of error. What the comparison does show is that households in unserved counties are often connected, by phone networks or satellite, rather than by a service the federal rules count as reliable.
Before quoting a county's figure
- Give the date. The US share of unserved locations was 7.4%4 on the first map and is 2.4%1 now; a county figure without its FCC as-of date may be years out of step.
- Available means reported available. A listing says a provider can install within ten business days. Anyone can challenge it on the FCC map, and each revision moves locations in and out of the count.
- Locations are not people. An apartment building is one location; the FCC data do not say how many people lack service.
- Unserved is a funding definition. The BEAD program uses it to decide which locations are eligible for its grants. The state ranking sets the county figures beside each state's totals and its underserved locations, and our article on why coverage numbers disagree explains why other sites publish different county numbers.
Questions about unserved counties
Which county has the worst broadband access in the US?
By the share of locations without reliable service of 25/3 Mbps, Kusilvak Census Area, Alaska (100.0%), then Bristol Bay Borough, Alaska (98.2%) and Eureka County, Nevada (97.7%), as of June 30, 2026. By number of unserved locations, San Diego County, California has the most, 17,950, although that is only 2.3%1 of its locations.
How many US counties have no broadband?
No county with a sizeable number of locations is entirely without terrestrial service, but 34 counties have half or more of their locations unserved and 1821 have a quarter or more. Satellite service is reported almost everywhere; the BEAD definition used here does not count it.
Is my county unserved?
The table on this page lists the hundred counties with the highest shares. Every county appears in the county table of its state's page, and the FCC National Broadband Map shows what providers report at a single address, where a listing can also be challenged.
Related rankings
Sources
- FCC, National Broadband Map, data as of June 30, 2026; Availability as of June 30, 2026; released November 10, 2026. broadbandmap.fcc.gov
- Census Bureau, Cartographic boundary file cb_2025_us_county_5m. www2.census.gov
- Census Bureau, American Community Survey 2020-2024 5-year detailed tables; 2020-2024; released January 29, 2026. api.census.gov
- FCC, National Broadband Map, data as of June 30, 2022; Availability as of June 30, 2022; released May 10, 2024. broadbandmap.fcc.gov
Margins of error (±) are at the 90% confidence level. A difference is called significant only when it passes the Census Bureau's test at that level. How every figure is built: methodology. Found an error? Write to [email protected]; corrections are listed on the updates page.