Unserved and underserved broadband locations by state
Alaska has the highest share of homes and businesses without reliable broadband of even 25/3 Mbps, 17.5%, and the District of Columbia the lowest, 0.0%. Texas has the most such locations, 218,000, out of 2.7 million1 nationwide, in FCC data as of June 30, 2026.
Data: FCC National Broadband Map, availability as of June 30, 2026 (file revision of November 10, 2026); Census Bureau, American Community Survey 2025 1-year estimates; NTIA, BEAD Final Proposal summaries.
Source: FCC, National Broadband Map, data as of June 30, 2026; Census Bureau, Cartographic boundary file cb_2025_us_state_20m. Darker states have larger gaps; DC is the dot. FCC file revision of November 10, 2026. Shares are of broadband serviceable locations (homes and businesses), not people.
On the FCC National Broadband Map as of June 30, 2026 (file revision of November 10, 2026), Alaska has the largest share of unserved homes and businesses, 17.5%, followed by West Virginia (11.4%), Wyoming (9.2%), Montana (9.1%) and Idaho (7.7%). The District of Columbia (0.0%), North Dakota (0.1%), Connecticut and New Jersey (both 0.2%) have the smallest. Across the country 2,740,686 locations are unserved, 2.4% of the total, and the middle state sits at 2.2%1.
| 1 | Alaska | 17.5% |
|---|---|---|
| 2 | West Virginia | 11.4% |
| 3 | Wyoming | 9.2% |
| 4 | Montana | 9.1% |
| 5 | Idaho | 7.7% |
| 6 | Washington | 5.3% |
| 7 | Louisiana | 5.1% |
| 8 | Arkansas | 4.8% |
| 9 | Alabama | 4.5% |
| 10 | Virginia | 4.2% |
| 11 | New Mexico | 4.2% |
| 12 | Colorado | 4.0% |
| 13 | Kentucky | 3.9% |
| 14 | Oregon | 3.8% |
| 15 | Maine | 3.8% |
| 16 | Missouri | 3.6% |
| 17 | Vermont | 3.6% |
| 18 | Oklahoma | 3.4% |
| 19 | Wisconsin | 3.4% |
| 20 | Nebraska | 2.9% |
| 21 | Arizona | 2.8% |
| 22 | Michigan | 2.7% |
| 23 | Hawaii | 2.5% |
| 24 | Pennsylvania | 2.5% |
| 25 | South Dakota | 2.4% |
| 26 | Minnesota | 2.2% |
| 27 | Iowa | 2.2% |
| 28 | Texas | 2.1% |
| 29 | Utah | 2.1% |
| 30 | Kansas | 2.0% |
| 31 | Nevada | 1.9% |
| 32 | North Carolina | 1.9% |
| 33 | Illinois | 1.8% |
| 34 | Indiana | 1.7% |
| 35 | California | 1.6% |
| 36 | Ohio | 1.5% |
| 37 | Georgia | 1.5% |
| =38 | New Hampshire | 1.3% |
| =38 | New York | 1.3% |
| 40 | Mississippi | 1.1% |
| 41 | Florida | 0.9% |
| 42 | Rhode Island | 0.9% |
| 43 | Tennessee | 0.9% |
| 44 | Maryland | 0.5% |
| 45 | South Carolina | 0.5% |
| 46 | Massachusetts | 0.5% |
| 47 | Delaware | 0.4% |
| 48 | New Jersey | 0.2% |
| 49 | Connecticut | 0.2% |
| 50 | North Dakota | 0.1% |
| 51 | District of Columbia | 0.0% |
| United States | 2.4% |
Source: FCC, National Broadband Map, data as of June 30, 2026. Rank 1 is the highest value; "=" marks a tie at the displayed precision. FCC file revision of November 10, 2026. Shares are of broadband serviceable locations (homes and businesses), not people.
Locations, not people
The question people type is how many residents lack broadband. The FCC map does not answer it in that form. The FCC map counts broadband serviceable locations: a house, an apartment building or a small business, each counted once whatever the number of people or units inside. Every figure on this page is a count or share of those locations.
"Unserved" follows the definitions of the Broadband Equity, Access, and Deployment (BEAD) program, the federal program run by NTIA that pays for networks in unserved and underserved areas. A location is unserved when no provider reports reliable service of at least 25 Mbps down and 3 Mbps up. Reliable means fiber, cable, DSL or licensed fixed wireless reported as low-latency; satellite and unlicensed fixed wireless do not count. A location with reliable service of 25/3 Mbps or more but below 100/20 Mbps is underserved. The methodology gives the full rules.
The Census Bureau measures the other side of the question: households that do not subscribe to internet service, whether or not it is available. Those survey figures are on the household subscriptions ranking.
The most unserved locations: a different list
Ranked by number rather than share, the order changes. Texas has 217,940 unserved locations, more than any other state, yet that is 2.1% of its homes and businesses, tied for 23rd lowest among the states. California follows with 168,684 (1.6%), then Washington with 137,562, Pennsylvania with 122,893 and Virginia with 122,184. Of the five states with the highest shares, only West Virginia is also among the ten largest counts, with 102,269. Alaska has 49,447 unserved locations and Wyoming 24,1291: large shares of small totals.
Source: FCC, National Broadband Map, data as of June 30, 2026. FCC file revision of November 10, 2026. Shares are of broadband serviceable locations (homes and businesses), not people.
Show the numbers
| State | Unserved (locations) |
|---|---|
| United States | 2,740,686 |
| Texas | 217,940 |
| California | 168,684 |
| Washington | 137,562 |
| Pennsylvania | 122,893 |
| Virginia | 122,184 |
| Michigan | 109,501 |
| West Virginia | 102,269 |
| Alabama | 98,853 |
| Louisiana | 95,090 |
| Missouri | 91,448 |
| North Carolina | 83,136 |
| Colorado | 80,260 |
| Wisconsin | 78,439 |
| Arizona | 76,966 |
| Illinois | 72,669 |
Both views matter. The count is closer to the size of the job of connecting everyone; the share says how likely a given home or business in the state is to be without reliable service.
| Texas | 10,399,220 | 217,940 | 2.1% | 139,289 | 0.5% |
|---|---|---|---|---|---|
| California | 10,289,142 | 168,684 | 1.6% | 91,086 | 0.7% |
| Washington | 2,577,599 | 137,562 | 5.3% | 91,591 | 1.7% |
| Pennsylvania | 4,883,670 | 122,893 | 2.5% | 57,848 | 0.9% |
| Virginia | 2,923,222 | 122,184 | 4.2% | 55,505 | 1.7% |
| West Virginia | 897,543 | 102,269 | 11.4% | 22,116 | 6.4% |
| Alaska | 282,929 | 49,447 | 17.5% | 15,420 | 7.2% |
| Wyoming | 262,480 | 24,129 | 9.2% | 13,910 | 3.8% |
| Montana | 498,334 | 45,538 | 9.1% | 27,919 | 3.5% |
| United States | 115,784,915 | 2,740,686 | 2.4% | 1,885,951 | 0.8% |
Source: FCC, National Broadband Map, data as of June 30, 2026. FCC file revision of November 10, 2026. Shares are of broadband serviceable locations (homes and businesses), not people.
Satellite-only locations are a minority of the unserved
An unserved location is not necessarily one with no service at all. Nationally, 962,554 locations, 0.8%, have no terrestrial provider of any kind and can order only satellite service. The rest of the 2.7 million1 unserved locations have some terrestrial provider listed, but one that fails the BEAD test: unlicensed fixed wireless, service slower than 25/3 Mbps, or service not reported as low-latency.
The two kinds of gap are spread differently. Alaska has the highest satellite-only share, 7.2%, and West Virginia the 2nd highest, 6.4%: in both, a large part of the unserved total has no ground network at all. In Idaho, by contrast, 7.7% of locations are unserved but 2.4% are satellite-only; in Wyoming the figures are 9.2% and 3.8%, and in Montana 9.1% and 3.5%1. Most of those western states' unserved locations do have a terrestrial provider on the map, just not one that counts as reliable.
Source: FCC, National Broadband Map, data as of June 30, 2026; Census Bureau, Cartographic boundary file cb_2025_us_state_20m. Darker states have larger gaps; DC is the dot. FCC file revision of November 10, 2026. Shares are of broadband serviceable locations (homes and businesses), not people.
Show the numbers
| State | Satellite only |
|---|---|
| Alaska | 7.2% |
| West Virginia | 6.4% |
| Wyoming | 3.8% |
| Montana | 3.5% |
| Idaho | 2.4% |
| Maine | 2.4% |
| Louisiana | 2.3% |
| Alabama | 1.9% |
| Arkansas | 1.8% |
| Virginia | 1.7% |
| Washington | 1.7% |
| Oregon | 1.7% |
| Hawaii | 1.4% |
| Kentucky | 1.2% |
| New Mexico | 1.2% |
| Colorado | 1.2% |
| Michigan | 1.2% |
| Wisconsin | 1.0% |
| Pennsylvania | 0.9% |
| New York | 0.8% |
| North Carolina | 0.8% |
| Minnesota | 0.7% |
| Arizona | 0.7% |
| Oklahoma | 0.7% |
| California | 0.7% |
| Rhode Island | 0.7% |
| Utah | 0.7% |
| Mississippi | 0.6% |
| South Dakota | 0.6% |
| Missouri | 0.6% |
| Nebraska | 0.6% |
| New Hampshire | 0.5% |
| Georgia | 0.5% |
| Texas | 0.5% |
| Ohio | 0.5% |
| Indiana | 0.5% |
| Illinois | 0.4% |
| Kansas | 0.4% |
| Tennessee | 0.4% |
| Iowa | 0.4% |
| Florida | 0.3% |
| Vermont | 0.3% |
| Massachusetts | 0.3% |
| Nevada | 0.3% |
| Maryland | 0.3% |
| South Carolina | 0.2% |
| Delaware | 0.1% |
| New Jersey | 0.1% |
| Connecticut | 0.1% |
| North Dakota | 0.0% |
| District of Columbia | 0.0% |
How far the gap has narrowed since 2022
On the first national map, as of June 30, 2022, 7.4% of US locations were unserved. The share has since fallen by 5.0 percentage points, and by 0.4 percentage points1 in the six months since December 31, 2025. In 2022 four states had more than a fifth of their locations unserved: Montana (24.3%), Alaska (22.4%), Mississippi (22.1%) and West Virginia (20.9%3).
Mississippi moved furthest. Its unserved share fell by 20.9 percentage points to 1.1%, the largest decline of any state, and it also had the largest drop of the latest six months (−3.1 percentage points). Over the same four years the share of Mississippi locations with fiber rose by 34.0 percentage points. Montana's share fell by 15.1 percentage points, the second-largest decline, Arkansas's by 12.4 percentage points and Kentucky's by 11.9 percentage points. Alaska's fell by only 4.9 percentage points, so it now heads the ranking. Rhode Island is the one state where the unserved share is higher than in 2022, 0.9%1 against 0.7%3, a small rise from a low base.
Source: FCC, National Broadband Map, data as of June 30, 2026. FCC file revision of November 10, 2026. Shares are of broadband serviceable locations (homes and businesses), not people.
Show the numbers
| State | Unserved: change since June 30, 2022 |
|---|---|
| Rhode Island | 0.2 pts |
| District of Columbia | −0.1 pts |
| New Jersey | −0.4 pts |
| Delaware | −0.5 pts |
| Massachusetts | −0.5 pts |
| Connecticut | −0.6 pts |
| Iowa | −1.2 pts |
| Maine | −1.3 pts |
| Oregon | −1.3 pts |
| Hawaii | −1.9 pts |
| Maryland | −1.9 pts |
| New York | −1.9 pts |
| California | −2.0 pts |
| Washington | −2.0 pts |
| Kansas | −2.7 pts |
| Ohio | −2.8 pts |
| North Dakota | −2.8 pts |
| Utah | −2.8 pts |
| Arizona | −2.9 pts |
| Nevada | −3.3 pts |
| New Hampshire | −3.4 pts |
| Illinois | −3.5 pts |
| Pennsylvania | −3.8 pts |
| Florida | −3.8 pts |
| Colorado | −4.2 pts |
| Idaho | −4.4 pts |
| North Carolina | −4.8 pts |
| Alaska | −4.9 pts |
| United States | −5.0 pts |
| Minnesota | −5.0 pts |
| Oklahoma | −5.2 pts |
| South Dakota | −5.4 pts |
| Texas | −5.7 pts |
| Tennessee | −5.9 pts |
| Wisconsin | −6.0 pts |
| South Carolina | −6.4 pts |
| Indiana | −6.4 pts |
| Wyoming | −7.0 pts |
| Nebraska | −7.2 pts |
| Virginia | −7.9 pts |
| Georgia | −8.1 pts |
| Missouri | −8.9 pts |
| Michigan | −9.2 pts |
| West Virginia | −9.5 pts |
| Vermont | −10.0 pts |
| Louisiana | −10.3 pts |
| New Mexico | −10.4 pts |
| Alabama | −10.6 pts |
| Kentucky | −11.9 pts |
| Arkansas | −12.4 pts |
| Montana | −15.1 pts |
| Mississippi | −20.9 pts |
Changes here compare shares, not counts: the FCC's list of locations changes with each release (a net change of +3,495,3291 since 2022), so a count can stay flat while the share falls.
Underserved: the second gap
Underserved locations are fewer, 1,885,951 or 1.6% of the US, and they rank differently. Wisconsin has 119,697 underserved locations, the second-largest number after Texas (139,289), and the 4th highest share, 5.2%. That is more than its unserved share of 3.4%: in Wisconsin, the more common gap is reliable service that stops short of 100/20 Mbps. Vermont (4.7% underserved, 3.6% unserved) shows the same pattern. Mississippi, after its drop, has almost no middle tier left: 0.3%1 of its locations are underserved.
Source: FCC, National Broadband Map, data as of June 30, 2026; Census Bureau, Cartographic boundary file cb_2025_us_state_20m. Darker states have larger gaps; DC is the dot. FCC file revision of November 10, 2026. Shares are of broadband serviceable locations (homes and businesses), not people.
Show the numbers
| State | Underserved |
|---|---|
| Montana | 5.6% |
| Alaska | 5.5% |
| Wyoming | 5.3% |
| Wisconsin | 5.2% |
| Vermont | 4.7% |
| Idaho | 4.1% |
| New Mexico | 4.0% |
| Arkansas | 3.9% |
| Washington | 3.6% |
| Kentucky | 3.0% |
| Colorado | 2.8% |
| Arizona | 2.7% |
| Alabama | 2.6% |
| Nebraska | 2.5% |
| West Virginia | 2.5% |
| Maine | 2.3% |
| Iowa | 2.3% |
| Oregon | 2.2% |
| Michigan | 2.2% |
| Louisiana | 2.2% |
| Missouri | 2.1% |
| Minnesota | 2.0% |
| Oklahoma | 2.0% |
| Kansas | 1.9% |
| Virginia | 1.9% |
| South Dakota | 1.8% |
| Indiana | 1.8% |
| Illinois | 1.8% |
| Ohio | 1.5% |
| North Carolina | 1.5% |
| Georgia | 1.4% |
| Texas | 1.3% |
| Utah | 1.3% |
| Pennsylvania | 1.2% |
| Delaware | 1.1% |
| Florida | 1.0% |
| California | 0.9% |
| Nevada | 0.9% |
| Tennessee | 0.7% |
| South Carolina | 0.6% |
| Maryland | 0.6% |
| New York | 0.4% |
| New Hampshire | 0.4% |
| Mississippi | 0.3% |
| Rhode Island | 0.2% |
| North Dakota | 0.2% |
| Hawaii | 0.1% |
| New Jersey | 0.1% |
| Massachusetts | 0.1% |
| Connecticut | 0.1% |
| District of Columbia | 0.0% |
Inside the states: county gaps
A state's share hides how unevenly the gaps fall inside it. Across all counties and county equivalents the median unserved share is 2.9%, but 182 counties have a quarter or more of their locations unserved and 34 half or more. The highest is Kusilvak Census Area, Alaska, at 100.0%; 11 of Alaska's boroughs and census areas are at half or more, while Anchorage is at 0.8%. In West Virginia the range runs from 1.2% in Ohio County to 54.3%1 in Braxton County. The county ranking lists them all.
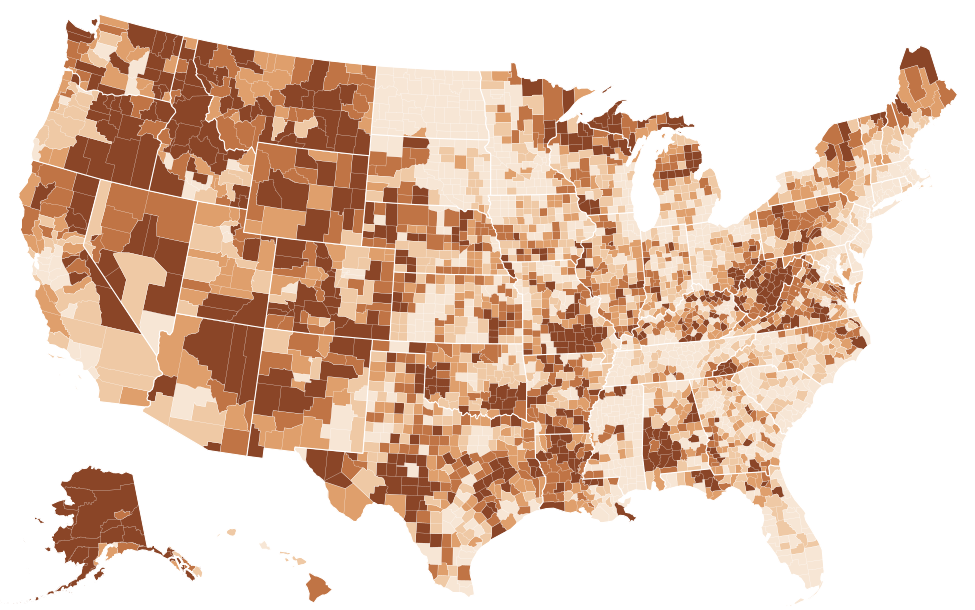
Source: FCC, National Broadband Map, data as of June 30, 2026; Census Bureau, Cartographic boundary file cb_2025_us_county_5m. FCC file revision of November 10, 2026. Shares are of broadband serviceable locations (homes and businesses), not people. The table lists the 25 highest and 25 lowest counties; every county is in the downloads.
Show the numbers
| County | Unserved |
|---|---|
| Kusilvak Census Area, Alaska | 100.0% |
| Yakutat City and Borough, Alaska | 100.0% |
| Bristol Bay Borough, Alaska | 98.2% |
| Eureka County, Nevada | 97.7% |
| Yukon-Koyukuk Census Area, Alaska | 96.2% |
| Esmeralda County, Nevada | 95.8% |
| Lake and Peninsula Borough, Alaska | 79.0% |
| Alpine County, California | 68.7% |
| Carter County, Missouri | 66.9% |
| Nome Census Area, Alaska | 65.8% |
| Park County, Colorado | 65.2% |
| Bethel Census Area, Alaska | 63.9% |
| Southeast Fairbanks Census Area, Alaska | 62.5% |
| Cameron Parish, Louisiana | 62.0% |
| Sierra County, California | 58.9% |
| Trinity County, California | 58.6% |
| Northwest Arctic Borough, Alaska | 57.4% |
| Dillingham Census Area, Alaska | 57.0% |
| Keweenaw County, Michigan | 56.6% |
| Kalawao County, Hawaii | 56.6% |
| Banner County, Nebraska | 55.5% |
| Ferry County, Washington | 55.5% |
| Boise County, Idaho | 54.9% |
| Shannon County, Missouri | 54.6% |
| Braxton County, West Virginia | 54.3% |
| Stutsman County, North Dakota | 0.0% |
| Towner County, North Dakota | 0.0% |
| Traill County, North Dakota | 0.0% |
| Walsh County, North Dakota | 0.0% |
| Ward County, North Dakota | 0.0% |
| Wells County, North Dakota | 0.0% |
| Horry County, South Carolina | 0.0% |
| Davison County, South Dakota | 0.0% |
| Harding County, South Dakota | 0.0% |
| Hyde County, South Dakota | 0.0% |
| Moody County, South Dakota | 0.0% |
| Sully County, South Dakota | 0.0% |
| Walworth County, South Dakota | 0.0% |
| DeKalb County, Tennessee | 0.0% |
| Fentress County, Tennessee | 0.0% |
| Grundy County, Tennessee | 0.0% |
| Hamblen County, Tennessee | 0.0% |
| Jackson County, Tennessee | 0.0% |
| Lake County, Tennessee | 0.0% |
| Montgomery County, Tennessee | 0.0% |
| Overton County, Tennessee | 0.0% |
| Bailey County, Texas | 0.0% |
| Lexington city, Virginia | 0.0% |
| Marion County, Alabama | 0.0% |
| San Francisco County, California | 0.0% |
The map and the BEAD plans count different things
Each state's BEAD final proposal names the locations it will fund. Across the states those plans cover 3,772,113 locations, while the June 2026 map shows 2,740,686 unserved and 1,885,951 underserved. The figures are separate counts and should not be read as one list: the plan totals come from NTIA's summaries of the final proposals, which NTIA notes are subject to change, and the map totals from the FCC's June 2026 release. West Virginia's plan covers 73,091 locations against 102,269 unserved on the current map; Alaska's covers 46,5085 against 49,4471. The BEAD funding ranking compares the plans by cost and technology, and each state page sets its plan beside its county gaps.
Pitfalls
- Unserved does not mean offline. Many unserved locations can order satellite or unlicensed fixed wireless service. The ranking measures what the BEAD rules count as reliable, not whether anyone is connected.
- Locations are not households. One apartment building is one location. Sites that convert locations to people or households use their own assumptions, which the FCC data do not support.
- Available means reported available. A provider's listing says it can install within ten business days; anyone can challenge a listing on the FCC map, and corrected listings move locations in and out of this count with each revision.
- Undated numbers are not comparable. The share fell from 7.4%3 to 2.4%1 between the first map and this one, so a figure without its FCC date can be years out of step. Our article on why coverage numbers disagree explains the other common differences.
Questions about unserved broadband by state
How many people lack broadband in West Virginia?
The FCC counts locations, not people. As of June 30, 2026, 102,269 homes and businesses in West Virginia, 11.4% of the state's locations, had no reliable service of 25/3 Mbps, the 2nd highest share among the states, after Alaska, and another 22,1161 had reliable service of 25/3 Mbps but not 100/20 Mbps. Counting subscriptions instead, the Census Bureau estimates that 10.1% of West Virginia households had no paid internet subscription in 2025 (margin of error ±0.7 percentage points6).
Which state has the most unserved broadband locations?
By number, Texas: 217,940 locations, which is 2.1% of its homes and businesses. By share, Alaska, at 17.5% (49,4471 locations).
What is the difference between unserved and underserved?
Both terms come from the federal BEAD program. An unserved location has no reliable service of at least 25/3 Mbps; an underserved one has reliable service of 25/3 Mbps or more but not 100/20 Mbps. Reliable means fiber, cable, DSL or licensed fixed wireless reported as low-latency. Nationally 2.4% of locations are unserved and 1.6%1 underserved.
Does satellite internet count as broadband in this ranking?
No. Under the BEAD definitions satellite and unlicensed fixed wireless do not make a location served, so a home that can order only satellite service is counted as unserved. Such satellite-only locations are 0.8%1 of the US total.
Related rankings
Sources
- FCC, National Broadband Map, data as of June 30, 2026; Availability as of June 30, 2026; released November 10, 2026. broadbandmap.fcc.gov
- Census Bureau, Cartographic boundary file cb_2025_us_state_20m. www2.census.gov
- FCC, National Broadband Map, data as of June 30, 2022; Availability as of June 30, 2022; released May 10, 2024. broadbandmap.fcc.gov
- Census Bureau, Cartographic boundary file cb_2025_us_county_5m. www2.census.gov
- NTIA BroadbandUSA, BEAD Final Proposal Overview one-page PDFs. broadbandusa.ntia.gov
- Census Bureau, American Community Survey 2025 1-year detailed tables; 2025 (calendar-year sample); released October 29, 2026. api.census.gov
Margins of error (±) are at the 90% confidence level. A difference is called significant only when it passes the Census Bureau's test at that level. How every figure is built: methodology. Found an error? Write to [email protected]; corrections are listed on the updates page.