Fiber internet expansion by state since 2022
Between the first National Broadband Map, as of June 30, 2022, and the release as of June 30, 2026, the share of homes and businesses with fiber available rose most in Maine (+48.4 percentage points) and least in the District of Columbia (+0.9 percentage points). Across the US, fiber went from 37.2%2 of locations to 62.6%1.
Data: FCC National Broadband Map, availability as of June 30, 2026 (file revision of November 10, 2026).
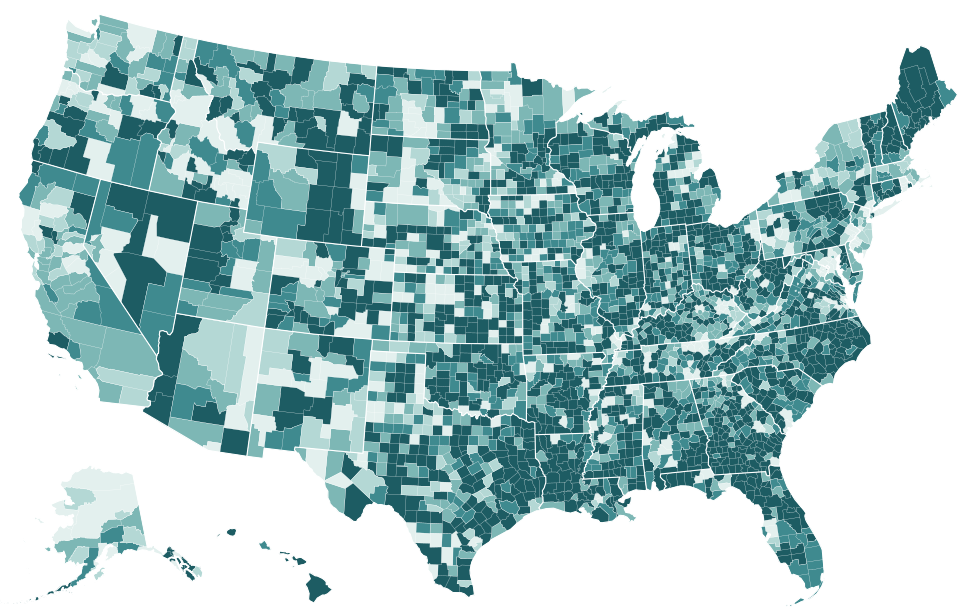
Source: FCC, National Broadband Map, data as of June 30, 2026; Census Bureau, Cartographic boundary file cb_2025_us_county_5m. FCC file revision of November 10, 2026. Shares are of broadband serviceable locations (homes and businesses), not people. The table lists the 25 highest and 25 lowest counties; every county is in the downloads.
Maine added fiber faster than any other state between June 30, 2022 and June 30, 2026: the share of its homes and businesses where a provider reports fiber to the premises changed by +48.4 percentage points. Hawaii (+41.7 percentage points), Wyoming (+41.3 percentage points), New Hampshire (+39.6 percentage points) and Vermont (+38.9 percentage points) complete the top five. The smallest gains were in the District of Columbia (+0.9 percentage points), Rhode Island (+6.7 percentage points) and New Jersey (+8.1 percentage points). The US as a whole rose by 25.4 percentage points; the median state changed by +28.5 percentage points1. Figures come from the FCC National Broadband Map, latest release as of June 30, 2026 in the file revision of November 10, 2026.
| 1 | Maine | 48.4 pts |
|---|---|---|
| 2 | Hawaii | 41.7 pts |
| 3 | Wyoming | 41.3 pts |
| 4 | New Hampshire | 39.6 pts |
| 5 | Vermont | 38.9 pts |
| 6 | Louisiana | 36.3 pts |
| 7 | Oklahoma | 35.7 pts |
| 8 | Kansas | 35.0 pts |
| 9 | Connecticut | 34.7 pts |
| 10 | Alabama | 34.2 pts |
| 11 | Utah | 34.1 pts |
| 12 | Mississippi | 34.0 pts |
| 13 | Arkansas | 33.2 pts |
| 14 | Iowa | 33.0 pts |
| 15 | West Virginia | 33.0 pts |
| 16 | North Carolina | 32.4 pts |
| 17 | Colorado | 31.7 pts |
| 18 | South Carolina | 31.3 pts |
| 19 | Missouri | 31.2 pts |
| 20 | Indiana | 30.4 pts |
| 21 | Wisconsin | 30.3 pts |
| 22 | Florida | 30.2 pts |
| 23 | Georgia | 29.9 pts |
| 24 | Tennessee | 28.9 pts |
| 25 | Texas | 28.8 pts |
| 26 | Ohio | 28.5 pts |
| 27 | Minnesota | 28.2 pts |
| 28 | Kentucky | 28.1 pts |
| 29 | Nebraska | 27.3 pts |
| 30 | Arizona | 27.2 pts |
| 31 | Michigan | 25.9 pts |
| 32 | Illinois | 23.9 pts |
| 33 | Montana | 23.5 pts |
| 34 | South Dakota | 22.9 pts |
| 35 | Nevada | 22.2 pts |
| 36 | Virginia | 22.0 pts |
| 37 | North Dakota | 21.3 pts |
| 38 | New Mexico | 19.2 pts |
| 39 | Pennsylvania | 18.7 pts |
| 40 | New York | 18.1 pts |
| 41 | Idaho | 17.3 pts |
| 42 | Oregon | 16.1 pts |
| 43 | California | 13.8 pts |
| 44 | Maryland | 12.8 pts |
| 45 | Washington | 11.3 pts |
| 46 | Alaska | 10.9 pts |
| 47 | Massachusetts | 10.7 pts |
| 48 | Delaware | 10.0 pts |
| 49 | New Jersey | 8.1 pts |
| 50 | Rhode Island | 6.7 pts |
| 51 | District of Columbia | 0.9 pts |
| United States | 25.4 pts |
Source: FCC, National Broadband Map, data as of June 30, 2026. Rank 1 is the highest value; "=" marks a tie at the displayed precision. FCC file revision of November 10, 2026. Shares are of broadband serviceable locations (homes and businesses), not people.
Source: FCC, National Broadband Map, data as of June 30, 2026. FCC file revision of November 10, 2026. Shares are of broadband serviceable locations (homes and businesses), not people.
Show the numbers
| State | Fiber available: change since June 30, 2022 |
|---|---|
| Maine | 48.4 pts |
| Hawaii | 41.7 pts |
| Wyoming | 41.3 pts |
| New Hampshire | 39.6 pts |
| Vermont | 38.9 pts |
| Louisiana | 36.3 pts |
| Oklahoma | 35.7 pts |
| Kansas | 35.0 pts |
| Connecticut | 34.7 pts |
| Alabama | 34.2 pts |
| Utah | 34.1 pts |
| Mississippi | 34.0 pts |
| Arkansas | 33.2 pts |
| Iowa | 33.0 pts |
| West Virginia | 33.0 pts |
| North Carolina | 32.4 pts |
| Colorado | 31.7 pts |
| South Carolina | 31.3 pts |
| Missouri | 31.2 pts |
| Indiana | 30.4 pts |
| Wisconsin | 30.3 pts |
| Florida | 30.2 pts |
| Georgia | 29.9 pts |
| Tennessee | 28.9 pts |
| Texas | 28.8 pts |
| Ohio | 28.5 pts |
| Minnesota | 28.2 pts |
| Kentucky | 28.1 pts |
| Nebraska | 27.3 pts |
| Arizona | 27.2 pts |
| Michigan | 25.9 pts |
| United States | 25.4 pts |
| Illinois | 23.9 pts |
| Montana | 23.5 pts |
| South Dakota | 22.9 pts |
| Nevada | 22.2 pts |
| Virginia | 22.0 pts |
| North Dakota | 21.3 pts |
| New Mexico | 19.2 pts |
| Pennsylvania | 18.7 pts |
| New York | 18.1 pts |
| Idaho | 17.3 pts |
| Oregon | 16.1 pts |
| California | 13.8 pts |
| Maryland | 12.8 pts |
| Washington | 11.3 pts |
| Alaska | 10.9 pts |
| Massachusetts | 10.7 pts |
| Delaware | 10.0 pts |
| New Jersey | 8.1 pts |
| Rhode Island | 6.7 pts |
| District of Columbia | 0.9 pts |
How growth is measured here
Each figure is a difference between two shares: the percentage of a state's broadband serviceable locations with fiber available as of June 30, 2026, minus the same percentage as of June 30, 2022. A location is a house, an apartment building or a small business, each counted once; it is not a household. "Available" means a provider reports it can install fiber service there within ten business days, and anyone can challenge that report on the FCC National Broadband Map.
The ranking uses percentage points rather than counts of new fiber locations because the FCC rebuilds its list of locations with every release. A count of fiber locations rises when homes are built or the list is corrected, not only when fiber is laid; a share compares like with like. The national gain of 25.4 percentage points is the rise in that share, from 37.2%2 to 62.6%1; it is not a percentage increase in the number of fiber connections.
The fastest growers started far apart
A high place in this ranking does not mean a state now has the most fiber. The top states began the period at very different levels.
| Maine | 14.4% | 62.8% | 48.4 pts | 16.4% |
|---|---|---|---|---|
| Wyoming | 15.7% | 56.9% | 41.3 pts | 5.9% |
| Hawaii | 41.1% | 82.7% | 41.7 pts | 0.6% |
| Vermont | 27.0% | 65.9% | 38.9 pts | 6.3% |
| Louisiana | 25.4% | 61.7% | 36.3 pts | 8.8% |
| Oklahoma | 35.8% | 71.5% | 35.7 pts | 15.4% |
| Utah | 42.3% | 76.4% | 34.1 pts | 33.8% |
| Kansas | 46.3% | 81.3% | 35.0 pts | 33.9% |
| Connecticut | 47.4% | 82.1% | 34.7 pts | 40.2% |
| Arizona | 14.4% | 41.5% | 27.2 pts | 7.7% |
| United States | 37.2% | 62.6% | 25.4 pts | 12.1% |
Source: FCC, National Broadband Map, data as of June 30, 2022; FCC, National Broadband Map, data as of June 30, 2026. FCC file revision of November 10, 2026. Shares are of broadband serviceable locations (homes and businesses), not people.
Maine and Hawaii were near the bottom in 2022, with fiber at 14.4% and 15.7% of locations. Both have moved toward the middle of the fiber availability ranking: Maine is now 23rd lowest at 62.8%, Wyoming 15th lowest at 56.9%. Arizona followed a similar path, from 14.4%2 to 41.5%, but is still the 4th lowest1.
Others were already above the national average and kept going. Wyoming rose from 41.1% to 82.7% and is now the 3rd highest state for fiber. Utah went from 42.3% to 76.4%, Kansas from 46.3% to 81.3%, and Connecticut, which started with fiber at more than half of its locations (47.4%2), reached 82.1%1.
The gains were broad inside the leading state. In Maine, even the county with the smallest increase, Oxford County, changed by +29.0 percentage points, more than the US as a whole; Somerset County changed by +84.5 percentage points and now has the state's highest share, 85.6%1. The Maine page has every county.
One network or many builders
States reached large gains with very different numbers of providers. Hawaii has the fewest fiber providers of any state, 4, and nearly all of its fiber belongs to one network: altafiber reports fiber at 81.8% of Hawaii's locations, out of a state total of 82.7%. Only 0.6%1 of Hawaii's locations have two or more fiber networks.
Iowa sits at the other end: 182 different providers report fiber there, the most of any state, and its share rose by 33.0 percentage points, from 44.5%2 to 77.5%. In Maine the largest single fiber footprint is Consolidated Communications, which reports fiber at 46.9% of locations among 161 fiber providers in the state. The map records who reports service, not who paid for the construction or why it happened when it did.
Small gains: a full network or a slow one
The bottom of the ranking holds two different kinds of state, and the table separates them by their starting point.
| District of Columbia | 86.5% | 87.4% | 0.9 pts | 0.6 pts |
|---|---|---|---|---|
| Rhode Island | 79.5% | 86.2% | 6.7 pts | −0.3 pts |
| Maryland | 56.5% | 69.4% | 12.8 pts | 1.9 pts |
| Delaware | 49.2% | 59.2% | 10.0 pts | 1.3 pts |
| New Jersey | 61.7% | 69.7% | 8.1 pts | 1.3 pts |
| Alaska | 6.2% | 17.1% | 10.9 pts | 0.9 pts |
| Washington | 28.2% | 39.4% | 11.3 pts | 1.6 pts |
| California | 34.0% | 47.8% | 13.8 pts | 1.8 pts |
| Massachusetts | 43.8% | 54.5% | 10.7 pts | 0.9 pts |
| Pennsylvania | 43.3% | 62.0% | 18.7 pts | 2.7 pts |
| United States | 37.2% | 62.6% | 25.4 pts | 2.7 pts |
Source: FCC, National Broadband Map, data as of June 30, 2022; FCC, National Broadband Map, data as of June 30, 2026. FCC file revision of November 10, 2026. Shares are of broadband serviceable locations (homes and businesses), not people.
The first group had little room left. The District of Columbia already had fiber at 86.5% of its locations in 2022 and still ranks the highest at 87.4%. Rhode Island (79.5% in 2022, 86.2% now) and Maryland (56.5%, 69.4%1) were in a similar position; Delaware and New Jersey began at 49.2% and 61.7%2, and New Jersey's modest gain hides a great deal of construction, described below.
The second group started low and stayed low. Massachusetts went from 6.2% to 17.1% and has the lowest share in the country. Alaska rose from 28.2% to 39.4%, now the 3rd lowest; in Thurston County fiber reaches 7.3% of locations. Oregon went from 34.0% to 47.8%, Massachusetts from 43.8%2 to 54.5%. Except in Alaska, cable is close to universal in these states: it is reported at 83.8% of locations in Washington, 90.5% in California and 97.4% in Massachusetts, against 57.6%1 in Alaska. The FCC counts cable separately from fiber; the broadband coverage ranking compares states on any wired service of 100/20 Mbps.
Small statewide gains can hide large local ones. In Washington, Columbia County gained +62.3 percentage points while Douglas County moved −7.8 percentage points; in California, Sutter County gained +57.9 percentage points and Tehama County moved +1.2 percentage points1.
A second fiber network
Part of the growth adds fiber where fiber already existed. The share of US locations with two or more fiber providers went from 3.1%2 to 12.1% over the four years, a rise of 9.1 percentage points1.
That second network is concentrated in a few states. In Connecticut the share with two or more fiber networks rose by 26.3 percentage points, nearly as much as its share with any fiber, and at 40.2% the state ranks the highest on that measure. New Jersey's rose by 12.2 percentage points and Utah's by 26.5 percentage points. In New Jersey that is more than the rise in its share with any fiber, 8.1 percentage points1, so much of the state's new fiber went to places that already had one fiber provider. The ranking above counts each location once, whether it has one fiber provider or three, so in states like these it understates how much fiber was laid.
The latest six months
Between December 31, 2025 and June 30, 2026, the national share rose by 2.7 percentage points, from 59.9% to 62.6%. Wyoming had the largest gain, +9.0 percentage points, from 47.9%4 to 56.9%. New Hampshire (+6.2 percentage points), New Mexico (+6.1 percentage points) and West Virginia (+5.2 percentage points) followed; New Mexico still has the 2nd lowest1 share of fiber in the country.
Source: FCC, National Broadband Map, data as of June 30, 2026. FCC file revision of November 10, 2026. Shares are of broadband serviceable locations (homes and businesses), not people.
Show the numbers
| State | Fiber available: change since December 31, 2025 |
|---|---|
| Wyoming | 9.0 pts |
| New Hampshire | 6.2 pts |
| New Mexico | 6.1 pts |
| West Virginia | 5.2 pts |
| Louisiana | 4.5 pts |
| Michigan | 4.0 pts |
| Ohio | 3.9 pts |
| Oklahoma | 3.9 pts |
| Wisconsin | 3.9 pts |
| Alabama | 3.7 pts |
| Colorado | 3.7 pts |
| South Carolina | 3.6 pts |
| Illinois | 3.6 pts |
| Florida | 3.5 pts |
| Kentucky | 3.3 pts |
| Indiana | 3.3 pts |
| North Carolina | 3.3 pts |
| Georgia | 3.3 pts |
| Missouri | 3.0 pts |
| Montana | 2.8 pts |
| United States | 2.7 pts |
| Hawaii | 2.7 pts |
| Arizona | 2.7 pts |
| Pennsylvania | 2.7 pts |
| Arkansas | 2.6 pts |
| Texas | 2.4 pts |
| Idaho | 2.4 pts |
| Kansas | 2.4 pts |
| Maine | 2.4 pts |
| Mississippi | 2.4 pts |
| Tennessee | 2.3 pts |
| Maryland | 1.9 pts |
| Minnesota | 1.9 pts |
| Virginia | 1.9 pts |
| California | 1.8 pts |
| Washington | 1.6 pts |
| Nevada | 1.6 pts |
| Nebraska | 1.5 pts |
| Iowa | 1.5 pts |
| New York | 1.4 pts |
| Delaware | 1.3 pts |
| New Jersey | 1.3 pts |
| Utah | 1.2 pts |
| Oregon | 1.0 pts |
| Vermont | 1.0 pts |
| Alaska | 0.9 pts |
| Massachusetts | 0.9 pts |
| Connecticut | 0.7 pts |
| District of Columbia | 0.6 pts |
| Rhode Island | −0.3 pts |
| North Dakota | −0.5 pts |
| South Dakota | −5.5 pts |
Three states moved down. South Dakota fell by 5.5 percentage points, from 67.3%4 to 61.8%, the largest drop of any state; North Dakota (−0.5 percentage points) and Rhode Island (−0.3 percentage points1) slipped slightly. A drop in one release does not show that fiber was removed. Providers revise their filings, challenges remove listings, and the FCC adds locations, so a share can fall without any change on the ground. One release is a weak basis for a trend; the four-year change is the steadier measure.
Pitfalls
- Growth is not coverage. A state can top this ranking and still have less fiber than one near the bottom: Maine's share today is below the District of Columbia's in 2022. Use the fiber availability ranking for where fiber is now.
- Points, not percent. A rise from 14.4%2 to 62.8% is 48.4 percentage points1; describing it as a percentage increase gives a much larger and less comparable number.
- Available is not subscribed. These figures count where fiber can be ordered, not where homes buy it. No federal survey reports fiber subscriptions by state.
- Undated figures cannot be compared. Expansion numbers elsewhere often mix FCC releases or provider announcements of planned construction. Every figure here is FCC data as of June 30, 2022, December 31, 2025 and June 30, 2026; our article on why coverage numbers disagree and the methodology explain the definitions.
Questions about fiber expansion
Which state has expanded fiber internet the most since 2022?
Maine. Fiber was reported at 14.4%2 of its homes and businesses as of June 30, 2022 and at 62.8% as of June 30, 2026, a rise of 48.4 percentage points. Hawaii (+41.7 percentage points) and Wyoming (+41.3 percentage points1) follow.
Did fiber availability fall anywhere?
Not over the four years: every state and DC gained. Over the latest six months three states slipped, South Dakota most, from 67.3%4 as of December 31, 2025 to 61.8%1. The FCC map does not record why a provider's listing changed.
How do I see fiber expansion in my state?
The table on this page gives every state's share in 2022 and 2026 and the change over the latest six months. Each state page shows fiber by county and lists the providers that report service there; for a single address, search it on the FCC National Broadband Map.
Related rankings
Sources
- FCC, National Broadband Map, data as of June 30, 2026; Availability as of June 30, 2026; released November 10, 2026. broadbandmap.fcc.gov
- FCC, National Broadband Map, data as of June 30, 2022; Availability as of June 30, 2022; released May 10, 2024. broadbandmap.fcc.gov
- Census Bureau, Cartographic boundary file cb_2025_us_county_5m. www2.census.gov
- FCC, National Broadband Map, data as of December 31, 2025; Availability as of December 31, 2025; released November 3, 2026. broadbandmap.fcc.gov
How every figure is built: methodology. Found an error? Write to [email protected]; corrections are listed on the updates page.